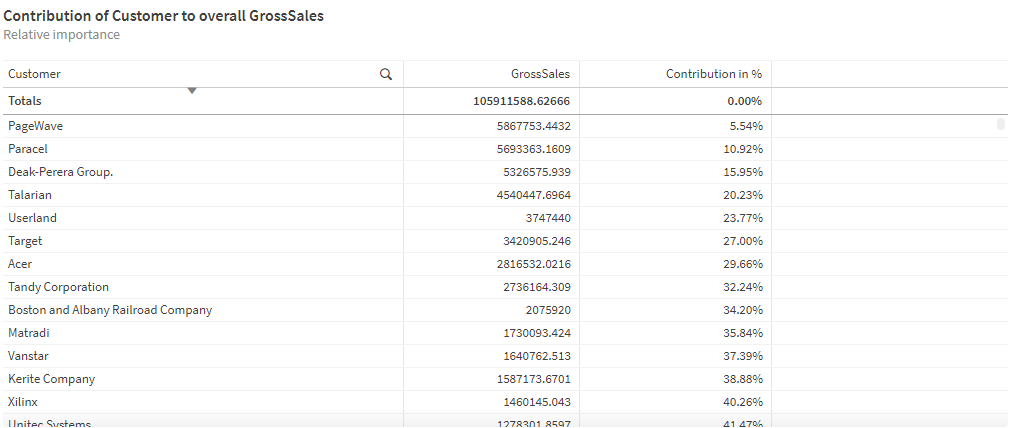
Relative importance analysis
Show the relative importance of dimensions contributing to a total.
Relative importance shows the size of dimension values that contribute to the whole. It can also be used to perform Pareto or 80-20 contribution analysis.
Relative importance analyses

Creating relative importance analyses
Do the following:
-
In Assets, click Analysis.
-
Drag and drop Relative importance into the sheet.
-
Click Add dimension and select a dimension.
-
Click Add measure and a select a measure.
-
Optionally, under Analysis properties, adjust the Limits.
Limits determines the grouping of items in the chart by their contribution percentage.
-
Optionally, in the properties panel, under Appearance, adjust the appearance of the analysis.
