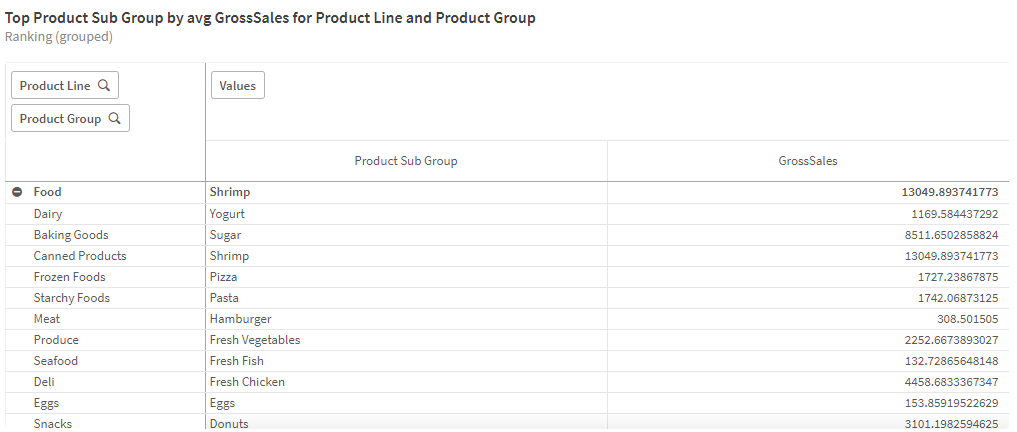
Ranking (grouped) analysis
Show hierarchical dimensions in order of their contribution to a measure.
Grouped ranking analyses group three dimensions in a hierarchy and view their contributions to the selected measure.
Ranking (grouped) analysis

Creating grouped ranking analyses
Do the following:
-
In Assets, click Analysis.
-
Drag and drop Ranking (grouped) into the sheet.
-
Click Add dimension and select the first dimension in the hierarchy.
-
Click Add dimension and select the second dimension in the hierarchy.
-
Click Add dimension and select the third dimension in the hierarchy.
-
Click Add measure and a select a measure.
-
Optionally, to add an analysis period, do the following:
-
In the properties panel, under Analysis properties, turn on Analysis period.
-
Under Calendar period, select the calendar period to use.
-
Under Period, select a specific period to use.
Information noteAnalysis periods requires calendar periods in the logical model. For more information, see Defining analysis periods with calendar periods. -
-
Optionally, in the properties panel, under Appearance, adjust the appearance of the analysis.
