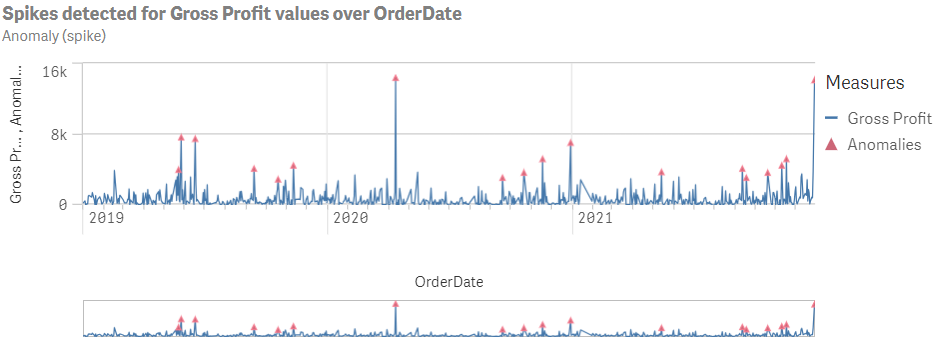
Anomaly (spike) analysis
Detect and show large data variations, including spikes and dips in a time series.
Anomaly (spike) analysis

Creating anomaly (spike) analyses
Do the following:
-
In Assets, click Analysis.
-
Drag and drop Anomaly (spike) into the sheet.
-
Click Add dimension and select a temporal dimension.
-
Click Add measure and select a measure.
-
Optionally, in the properties panel, under Appearance, adjust the appearance of the analysis.
