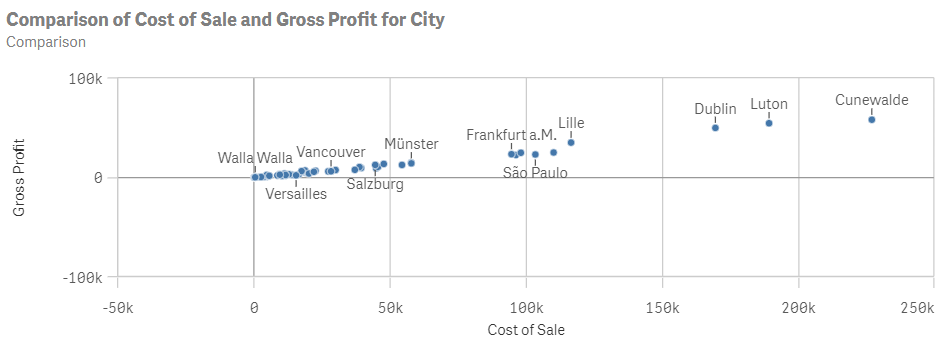
Comparison analysis
Show multiple measures for a dimension.
You can compare:
-
Two to four measures for a single dimension.
-
Two to three measures for two dimensions.
Comparison analysis

Creating comparison analyses
Do the following:
-
In Assets, click Analysis.
-
Drag and drop Comparison into the sheet.
-
Click Add dimension and select a dimension.
-
Click Add measure and select a measure.
-
Click Add measure and select the second measure.
-
Optionally, in the properties panel, under Alternative charts, select the chart to use in the analysis.
-
Optionally, in Data, click Add and select additional dimensions or measure.
-
Optionally, to add an analysis period, do the following:
-
In the properties panel, under Analysis properties, turn on Analysis period.
-
Under Calendar period, select the calendar period to use.
-
Under Period, select a specific period to use.
Information noteAnalysis periods requires calendar periods in the logical model. For more information, see Defining analysis periods with calendar periods. -
-
Optionally, in the properties panel, under Appearance, adjust the appearance of the analysis.
