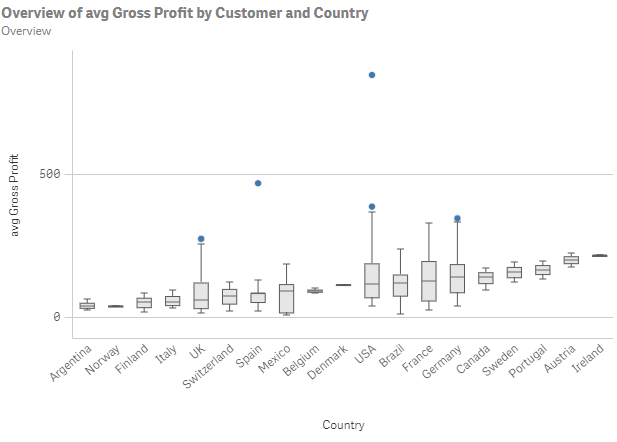
Overview analysis
Show the distribution of measures for one or more dimensions.
Overview describes how data ranges relate to each other in terms of an absolute measure.
Overview analysis

Creating overview analyses
Do the following:
-
In Assets, click Analysis.
-
Drag and drop Overview into the sheet.
-
Click Add dimension and select a dimension.
-
Click Add measure and a select a measure.
-
Optionally, to add a second dimension, in the properties panel, under Data, click Add.
-
Optionally, to add an analysis period, do the following:
-
In the properties panel, under Analysis properties, turn on Analysis period.
-
Under Calendar period, select the calendar period to use.
-
Under Period, select a specific period to use.
Information noteAnalysis periods requires calendar periods in the logical model. For more information, see Defining analysis periods with calendar periods. -
-
Optionally, in the properties panel, under Appearance, adjust the appearance of the analysis.
