Visualization settings
Containers
Containers are the collection which will be your starting point for analysis going forward. This can be your entire BI solution, but it can also be a subset. For example, they can help you separate different business areas or countries, or they can help you keep your QlikView, Qlik Sense, Power BI and Tableau environments separated. For information about how to plan for a NodeGraph implementation, please read NodeGraph Technical Enablement.
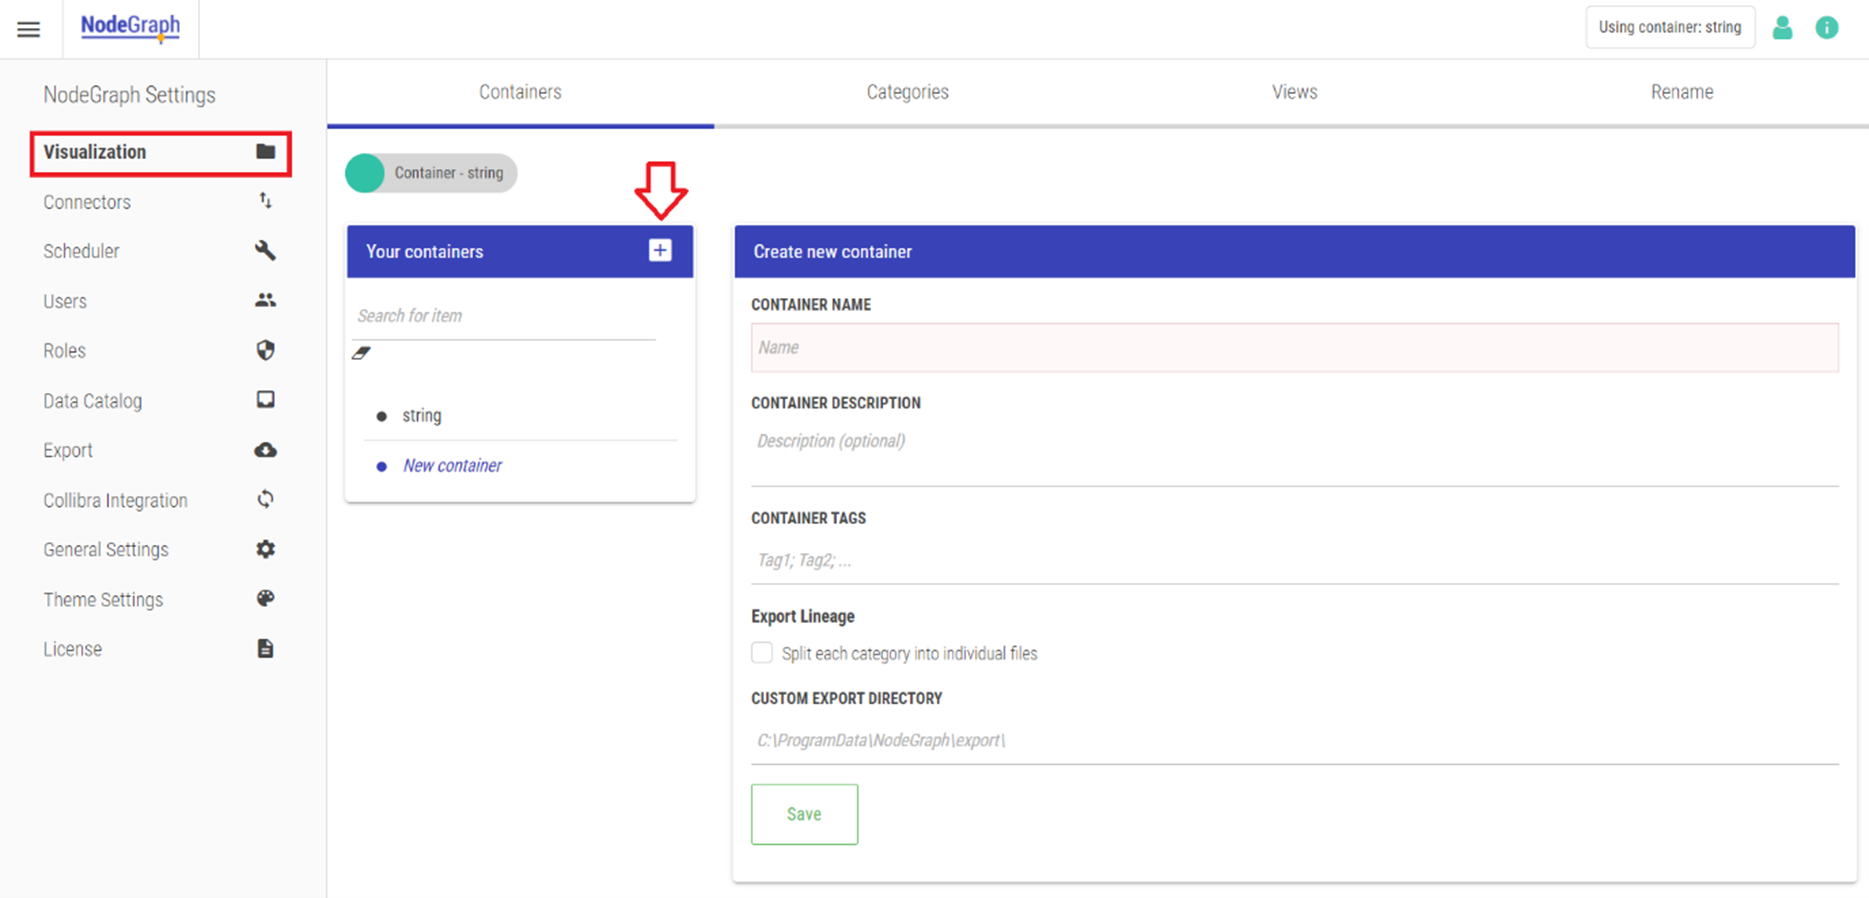
To set up a container, select “New Container” by pressing the plus sign and give the container a name and a description (optional). Please note that the container name must be unique. This will show in your upper-right corner.
Add a new Container

If you have more than one container, you will find a drop-down menu in the top right corner.
When you create a container, you will have the option of including the following information:
Container tags: Allows to connect a container to a specific user/user group so that only that user/user group can view the container. See section 4.2 Authentication for more information.
Export Lineage: If the license allows Export lineage, enter the directory location.
You can also choose to copy containers, whereby a duplicate will be created.
Categories
The second section under Visualization is Categories. In this section, you will choose how you want NodeGraph to visualize your data. The categories you create will decide how your Dependency Explorer will look.
All nodes extracted though the connectors are bound to one or more categories, so it is best to create the expected categories first. Categories can be moved around by the Layer / Sort order settings after build without a new reload of the data. This allows for experimenting.
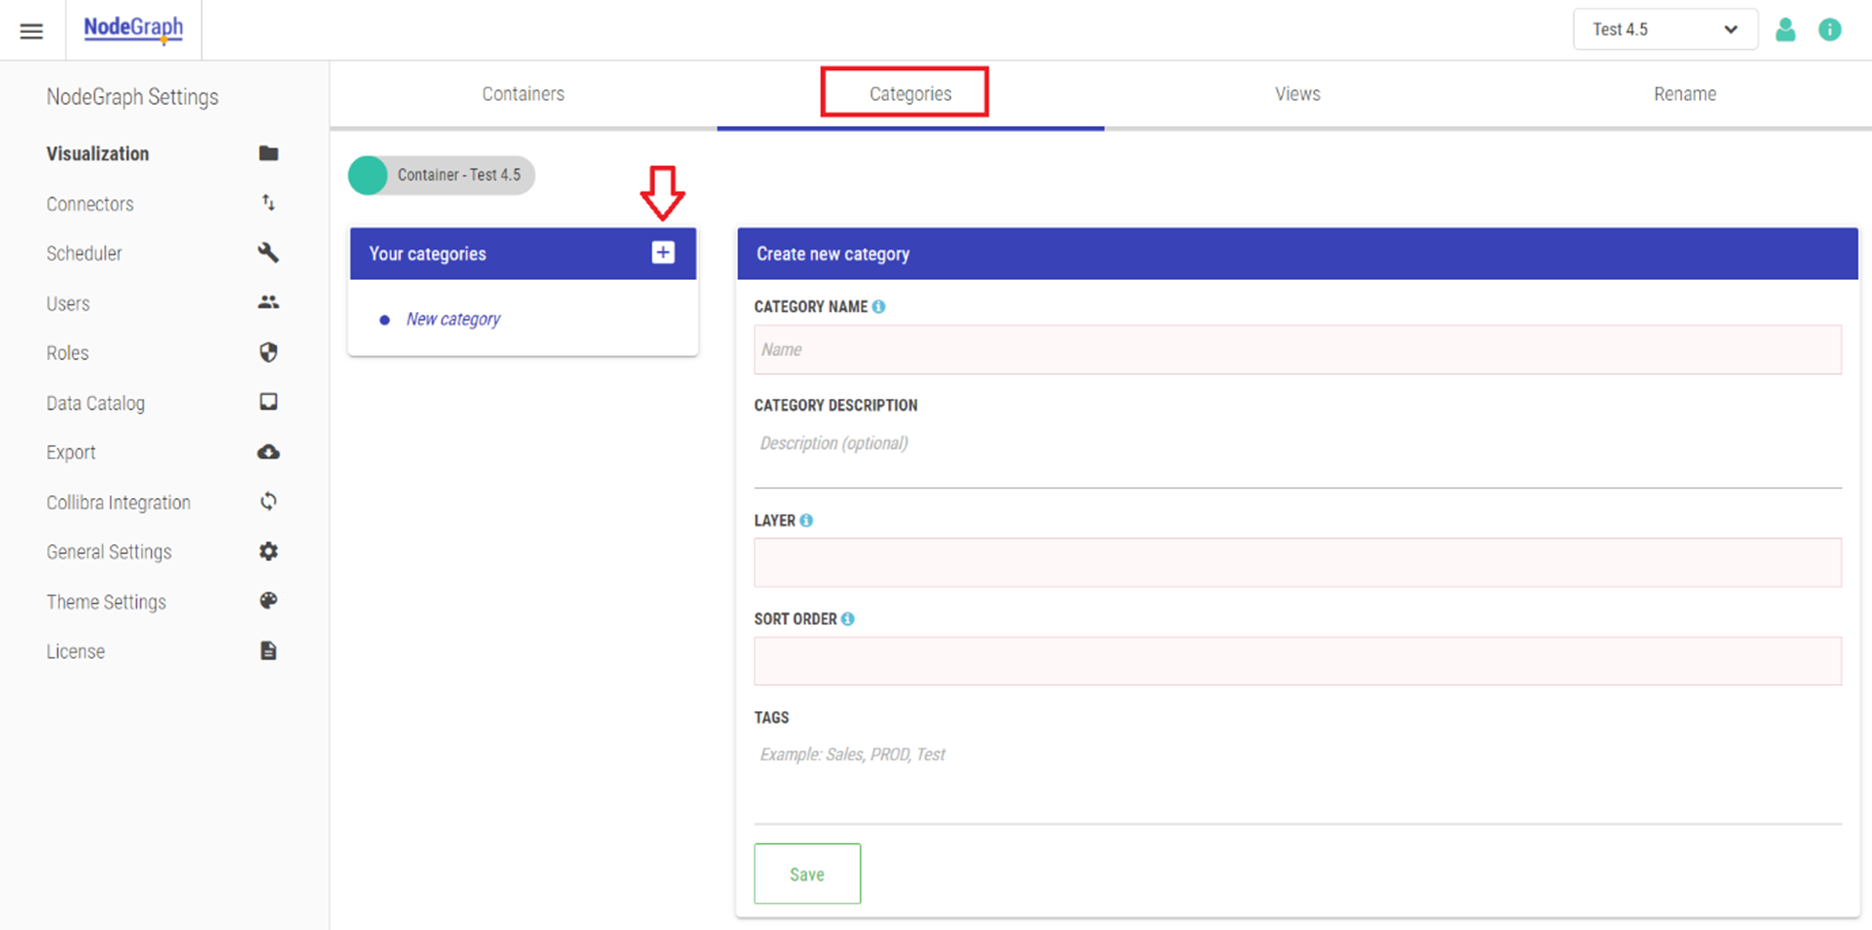
To create a new category, select “New Category”. Then enter a name and a description (optional) for the category.
Add a new Category

Layer: Decide where this category will be placed on the horizontal axis in the Dependency Explorer. By default, data sources are always placed on layer 0, that is, to the very left.
Sorting order: If having multiple categories within the same layer, use a number to order them.
Once a category is created, you will be able to copy it, thereby creating a duplicate.
In addition to the category tab, you can also create Categories when creating Connector Rules.
Creating Categories via the Add Rule prompt
It is also possible to create new Categories when creating a new Rule. Different rules will need different categories, but they are all created in the same way.
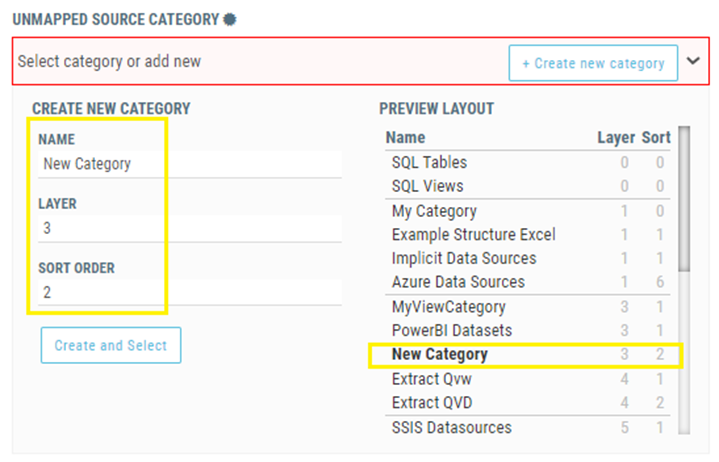
Start by clicking on the “+ Create new category” button. Include a name and the layer and sort order. On the Preview layout you will see where the new category will be placed in relation to existing categories. Finish by clicking on the “Create and select” button.
Create a new Category via Add Rule prompt

Views
Views are ways of limiting the amount of information visible on the Dependency Explorer at any time. Multiple views can be created to have an end-to-end overview of all the data in the BI environment.
Rename
In this section you can rename connections and see the renaming you have done via the GUI. Please see Rename and comment on data connections for more information.
