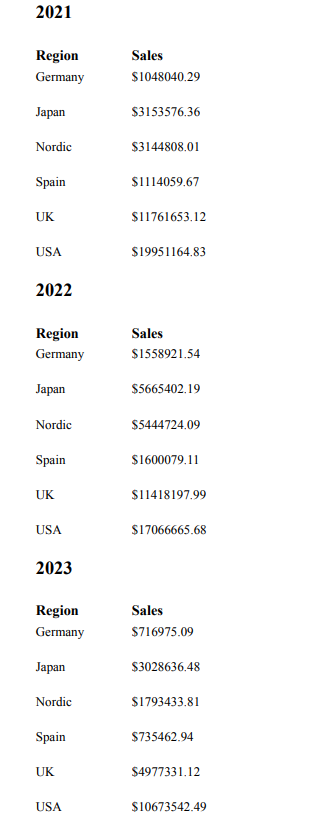
Example - Highly formatted table with sub-bands
In this example, we create a highly formatted table and use sub-bands to create different versions of this table, each with different filtering.
Refer to the example app sources here: Example materials - In-app reporting. Upload the app and data files into a space, and then reload the app. You are ready to complete the example.

Step 1: Create data bindings
Do the following:
-
Create a new PixelPerfect template.
-
Open the
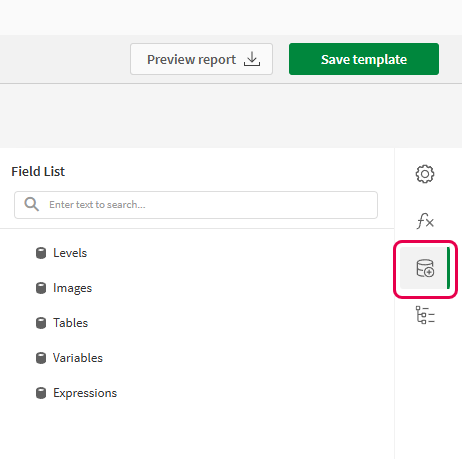
Field List menu available from the right-side panel in the designer.
Field List menu in the PixelPerfect designer
-
Hover your cursor over Levels, and then click
.
-
Expand the Sales Tables sheet. Next to Yearly Regional Sales, click
.
-
You are brought back to the main menu in the
Field List. Hover your cursor over Levels again, and then click
.
-
Expand Fields. Click
next to OrderYear. The data binding is created.
Step 2: Create the banded structure
Do the following:
-
On the design surface, right-click anywhere within the Detail1 band and click Insert Band > DetailReport.
A new DetailReport band is inserted below Detail1.
-
Right-click the Detail2 band within the DetailReport band you just created. Click Insert Band > DetailReport.
A new DetailReport band is inserted and nested within the first DetailReport band you created.
-
Right-click the Detail3 band within the second DetailReport band you just created. Click Insert Band > GroupHeader.
The band is inserted above the Detail3 band.
-
Right-click the GroupHeader1 band you just created, and select Insert Sub-Band. The sub-band band is inserted within the parent GroupHeader1 band. Repeat this process two more times, so that there are three sub-bands nested within GroupHeader1.
-
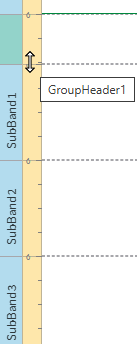
Select the GroupHeader1 band. Move your cursor into the yellow vertical ruler, and position it at the top of the first sub-band. Click and drag so that the space above the first sub-band is much smaller.
Using the cursor to resize the space above the first sub-band
Step 3: Bind the content to the data sources
Do the following:
-
Select the outermost DetailReport band in the structure (DetailReport1).
-
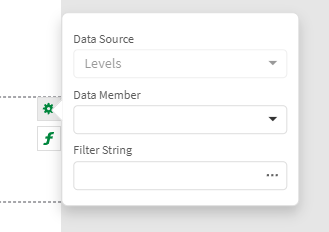
Click the gear icon at the edge of the design surface.
Clicking the gear icon
-
In the menu, select the OrderYear level as the Data Member. This creates a separate table for each region in the app. However, we will be using sub-bands to only show three of the regions in the app.
Tip noteAlternatively, clickat the far right of the designer. Add the Data Member under Detail Report Tasks.
-
Next, select the DetailReport2 band, and again click the gear icon at the edge of the design surface.
-
In the menu, select the Yearly Regional Sales level as the Data Member. This binds the table structure to the chart's source data.
-
Open the
Field List menu, and expand Levels.
-
Within the Yearly Regional Sales level, drag the Region and Sales fields onto the Detail3 band that is located below the sub-bands.
-
Arrange the field items on the band so they resemble two adjacent rows in a table.
Tip noteTo align objects precisely with the grid, resize them manually until they are as close to grid lines as possible. Then, right-click each object and select Layout > Size to Grid. You can also open the
Properties menu and adjust their size values numerically under Layout > Size.
For more information, see Arranging content in your PixelPerfect report template.
-
We need to format the Sales values as currency figures. Click the Sales label, and then click the gear icon that appears next to it.
-
In the popout menu, click the ellipsis (three dots) menu under Text Format String.
-
The Format String Editor dialog opens. Choose Currency, and adjust the decimal points. Click OK.
-
Resize the Detail3 band, shrinking it so that it is only as small as the items in it.
Step 4: Add conditions to the sub-bands
We need to configure each of the sub-bands so that it only appears when a particular value in the Region level cycle is present.
Do the following:
-
Select SubBand1.
-
Click
on the right side panel to expand the Expressions menu.
-
In the menu, click the three-dot icon next to Visible.
The Expression Editor opens.
-
In the Expression Editor, enter the following expression:
Iif( [OrderYear] == 2021, True, False ) -
Repeat this process for the other sub-bands, but add the following expressions for each:
-
SubBand2:
Iif( [OrderYear] == 2022, True, False ) -
SubBand3:
Iif( [OrderYear] == 2023, True, False )
-
Step 5: Add titles and column headers
Do the following:
-
Let's add a title for the level controlling the creation of separate tables. Open the
Field List menu, and expand Levels.
-
Expand the OrderYear level, and drag the OrderYear field within it onto the Detail2 band.
-
Customize font properties in the
Properties menu under Appearance > Font.
-
Resize the object as desired and then change the band size so that the objects take up the entire band height.
-
Next, let's add column headers for the sub-bands. From the toolbox on the left side of the designer, drag two
Label objects (one for Region, one for Sales) onto SubBand1.
-
Arrange the labels at the top of SubBand1, or as desired.
-
Double-click each label and insert your own custom fixed text. In this case, you can use the field names.
-
Customize font as desired. For example, you might want columns headers to stand out, so you could make them bold.
-
Copy the two labels and paste them onto SubBand2 and SubBand3.
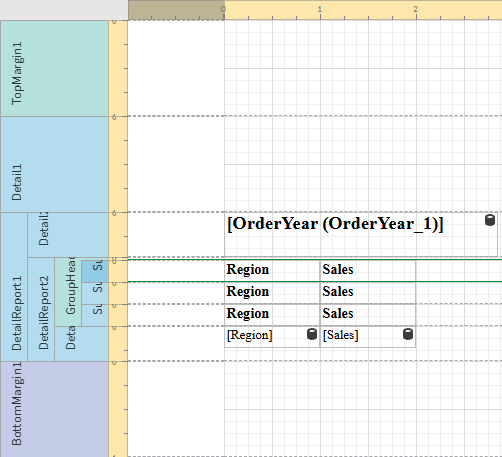
Your template should look something like the following.
Report template for example with sub-bands
Click Save template, and then click Preview report. Download the report and open it.
Report preview
