Using a level to loop over app data
You can loop and repeat the creation of report elements using data from the Qlik Sense app.
For an overview of levels, see Working with levels.

High-level workflow
This is the recommended workflow for using levels in your PixelPerfect report. It covers some of the most common and simple ways to work with levels in the designer.
Part 1: Add data bindings
First, you need to add the data binding that will be used to cycle the generation of unique report elements. For example, if you want a separate section in the report for each region, you need to add a Region field as a data binding. Data bindings are added in the Field List menu.
This workflow assumes you already have content, in the applicable areas in the template, for which you want to create a level.
Do the following:
-
Open the
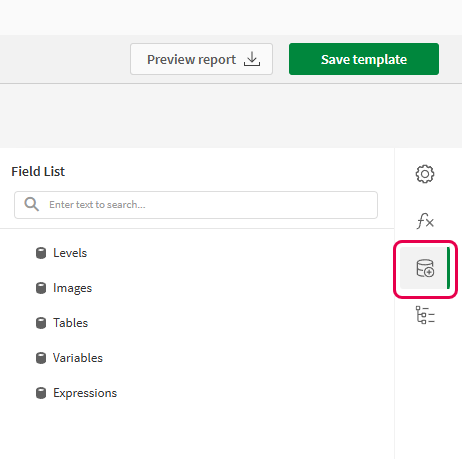
Field List menu available from the right-side panel in the designer.
-
Click the plus icon next to Levels.
-
Expand the sections to find the item you want to use. You can select a field from Fields, or an entire chart from any of the sheet sections.
-
Click the
icon next to an item to add it as a data binding.
Part 2: Connecting the data binding to the band
Next, you need to connect the level data binding to a band.
You cannot bind a level to the default Detail1 band, so you will need to create a new DetailReport band for content where you plan on using a level.
Do the following:
-
Create a new DetailReport band. See Creating a new band.
-
Select the new band, if not already selected.
-
Open the
Properties menu from the right side of the designer.
-
Under Detail Report Tasks > Data Member, select the item to use as the level.
Example - Looping chart images over a dimension
Refer to the example app sources here: Example materials - In-app reporting. Upload the app and data files into a space, and then reload the app. You are ready to complete the example.
Part 1: Add data bindings
Do the following:
-
Create a new PixelPerfect template.
-
Open the
Field List in the designer.
Field List menu in the PixelPerfect designer

-
Click the plus icon next to Levels.
-
Expand Fields, and click the
icon next to the Region chart.
The data binding is added.
-
You are brought back to the main
Field List menu. Click the plus icon next to Images.
-
Expand the Dashboard sheet, and click the
icon next to the Top 5 Customers chart.
The data binding is added.
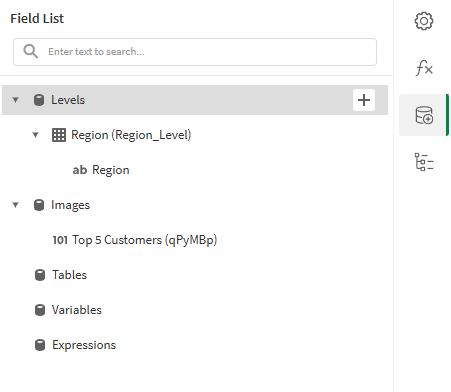
Field List menu showing newly created level and image data bindings

Part 2: Add band and content
Do the following:
-
On the design surface, right-click the Detail1 band and select Insert Band > DetailReport.
-
Open the
Field List menu, and double-click Levels to expand it.
-
For Region, expand the level object and drag the Region field within it onto the DetailReport1 band.
Position the label at the top of the band.
-
In the
Field List menu, expand Images and drag Top 5 Customers onto the DetailReport1 band. Place it below the Region label.
You can customize and style the content as desired.
Part 3: Bind the level to the band
Do the following:
-
Click the DetailReport1 band.
-
Open the
Properties menu from the right side of the designer.
-
Under Detail Report Tasks > Data Member, select the Region field.
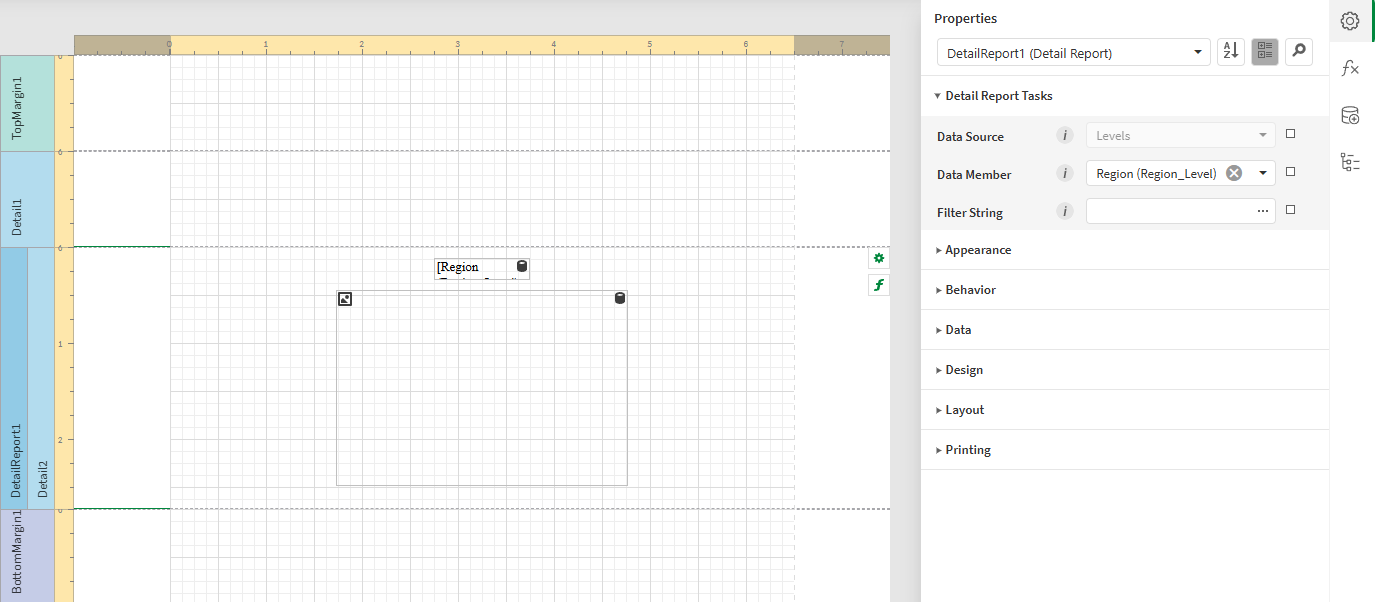
Report template with content and DetailReport1 band bound to level

-
In the top right corner, click Save template.
-
Click Preview report. Download the report and open it.
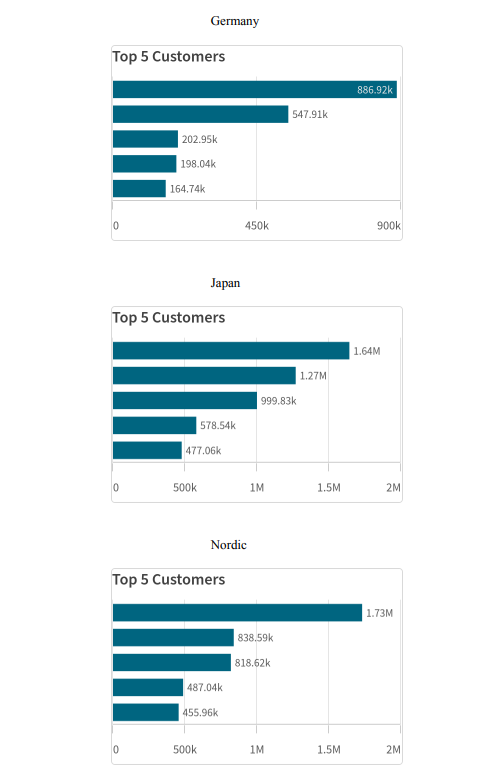
Report preview

