This scenario describes a basic Job that generates a sample of duplicate
data from an input flow by using probability theories and specific criteria on three columns:
Name, City and DOB (date
of birth).
This scenario applies only to Talend Data Management Platform, Talend Big Data Platform, Talend Real-Time Big Data Platform, Talend MDM Platform, Talend Data Services Platform, Talend MDM Platform and
Talend Data Fabric.
This scenario uses:
tFileInputDelimited as the input component.
tDuplicateRow to generate duplicate data from the input
flow.
tFileOutputDelimited to output the data in a delimited file.
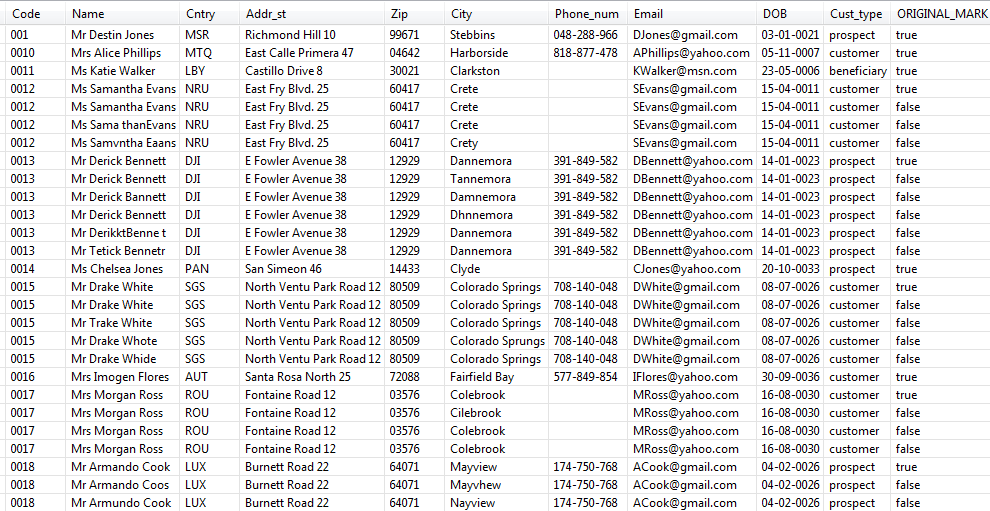
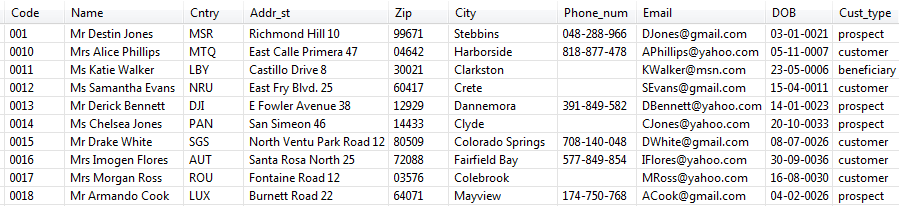
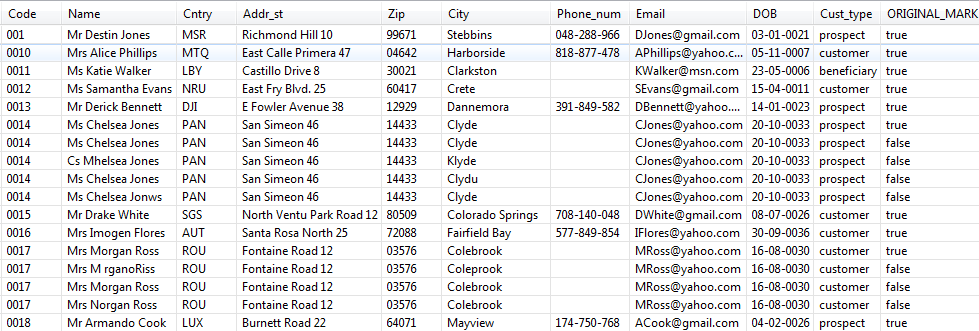
Below is a capture of a sample data of the input flow:
Setting up the Job
Procedure
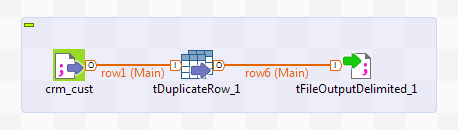
Drop the following components from the Palette onto the design workspace: tFileInputDelimited, tDuplicateRow and tFileOutputDelimited.
Connect all the components together using the Row
> Main link.
Configuring the input data
Procedure
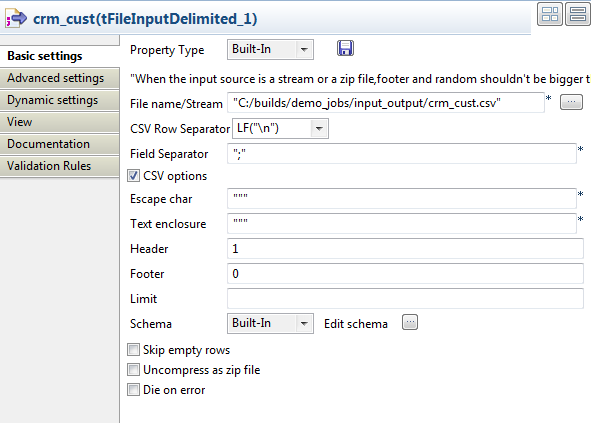
Double-click tFileInputDelimited to display
the Basic settings view and define the
component properties.
In the File name/Stream field, browse to the
file to be used as the main input.
This file provides some information about customers.
Define the row and field separators the header and footer in the corresponding
fields, if any.
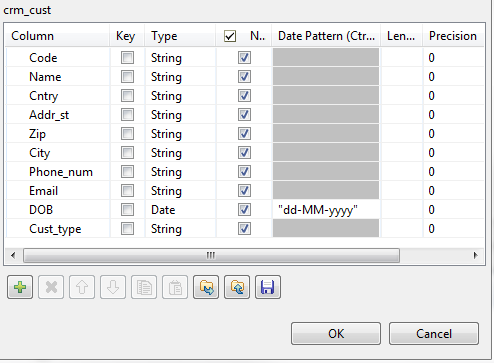
Click the [...] button next to Edit schema to open a dialog box and define the input
schema.
According to the input file structure, the schema is made of ten columns.
Click the [+] button and define the input
columns in the dialog box as in the above figure. Click OK to close the dialog box.
If needed, right-click tFileInputDelimited
and select Data Viewer to display a view of the
input data.
Configuring the duplicate data
Procedure
Double-click tDuplicateRow to display the
Basic settings view and define the
component properties.
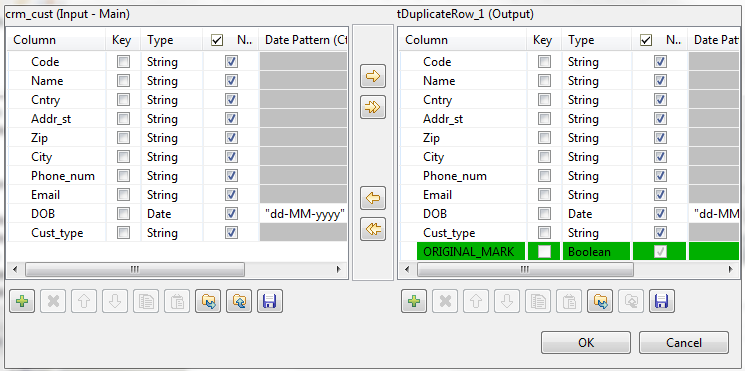
Click the Edit schema button to view the
input and output columns and do any modifications in the output schema, if
needed.
The output schema of this component contains one read-only column,
ORIGINAL_MARK. This column identifies, by
true or false, if the record is an original or a
duplicate record. There is only one original record per group of
duplicates.
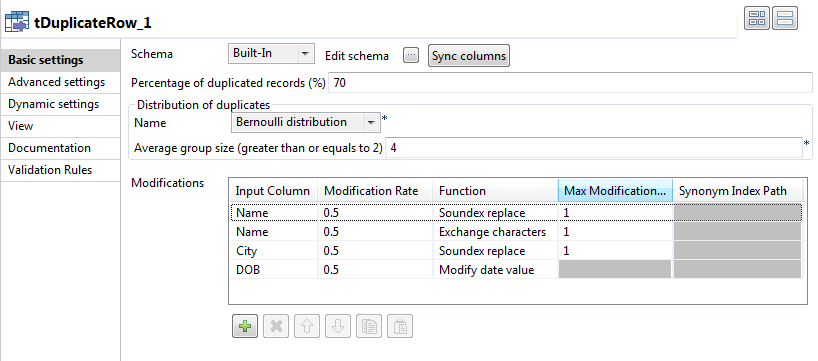
In the Percentage of duplicated records
field, enter the percentage of the duplicate rows you want to have in the output
flow.
In the Distribution of
duplicates area, select the Bernoulli
distribution (probability theory) you want to use to generate
duplicates.
Set an average of how many duplicate records to have in each group.
Click the plus button below the Modifications
table and add four lines in the table.
This table enables you to define what values to change in a given column and
how to change them in order to generate duplicates:
In the Input Column, select the
column from the input flow from which you want to generate duplicates,
Name, City and
DOB in this example.
When you add a column twice in the table and select different
functions, you generate duplicates from the same field with different
values. For example, in this scenario you modify the duplicate names
with the Soundex replace function with probability
of 50%, and then you modify it again with the Exchange
characters function with the probability of 50%. This
means, the Name field of the duplicate record may
still not be modified after the second function with the following
probability: (1-0.5)*(1-0.5) = 0.25.
If you want to make sure that all the duplicated records are modified,
you must set the Modification Rate to
1.
In the Modification Rate column,
enter a rate of the duplicate records you want to generate from the
input column.
From the Function list, select the
function that will decide what modification to do on a value to
duplicate it.
In this example, there will be duplicate names with different sounds
and characters and duplicate city names with different sounds. Date
values in the date of birth column will be randomly changed here.
In the Max Modification Count column,
enter a maximum number of the values to be modified in each
field.
Click the Advanced settings tab and enter a
random number in the Seed for random generator
field.
By setting a number in this field, you will generate the same sample of
duplicate data in each execution of the Job. Change the value if you want to
generate a different sample.
Configuring the output component
Procedure
Double-click tFileOutputDelimited to display
its Basic settings view and define the
component properties.
In the File Name field, specify the path to
the file to which you want to write the duplicate data,
duplicated_records in this example.
Define the row and field separators in the corresponding fields, if
any.
Executing the Job
Procedure
Save your Job and press F6 to execute
it.
Duplicate data is generated and written to the output file.
Right-click the output component and select Data
Viewer to display the duplicate data.
Duplicate records have been marked as false in the
ORIGINAL_MARK column.
Some data has been modified in the Name,
City and DOB fields according to
the criteria you set in the Modifications table
and duplicate records have been generated based on these modifications.
For example, if you compare the original name Mrs Morgan Ross and the duplicate name Mrs M rganosRiss, you see that the two functions have been used on this
duplicate record: the letter o has been exchanged with a
space, and also the sound has been replaced in Ross and Riss. However, the soundex code has not been changed for
the replaced sound.
In the tDuplicateRow basic settings and in
the Distribution of duplicates area, select a
different distribution, Bernoulli distribution for example,
and run the Job.
Different duplicates are generated from the same input flow according to the
selected distribution as shown in the below figure.
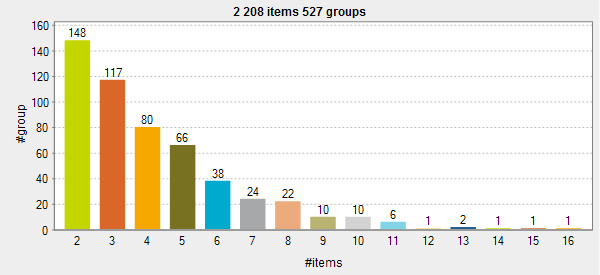
Showing chart results of each of the probability distributions
The best way to see how duplicates are generated according to each of the
three probability distributions is to create a match analysis on each of the results and
compare the charts.
Procedure
From the Profiling perspective,
right-click Metadata and create a file
connection to the duplicated_records output file generated
by the Job.
Expand the new file connection under Metadata
and select Analyze matches.
Follow the steps in the wizard to define the analysis metadata and click
Finish to open the analysis editor.
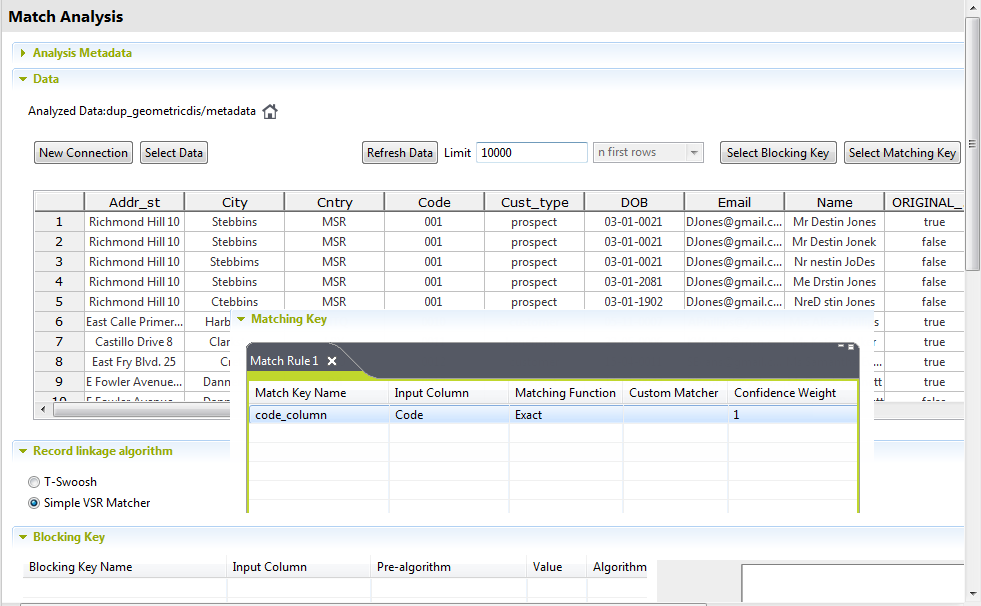
In the Matching Key table, define a match key
on the Code column to group records by their
identification, records which have the same code are grouped together.
Click Chart below the table to show the
duplicates generated according to the Bernoulli
distribution selected previously in the Job.
Switch back to the Integration perspective, select Poisson
distribution in the basic settings of tDuplicateRow
and run the Job.
In the Profiling perspective, click Chart below the Matching Key
table to show the duplicates generated according to the Poisson distribution.
Run the Job with the Geometric distribution,
then click the Chart in the Profiling to show the duplicates generated according
to the Geometric distribution.
Results
The results of the generated duplicates differ according to the probability
distribution you select in the tDuplicateRow
component.
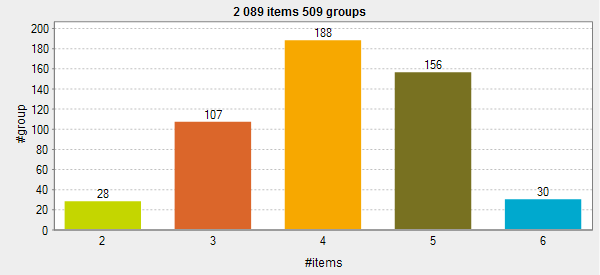
Bernoulli distribution: The curve is
symmetrical. The groups of duplicates are distributed evenly on each side of an
average value, 4 in this example. This average value is the average number of
duplicates in a group of duplicates and this value is the number you set in the
Average group size field in the basic
settings of the tDuplicateRow component.
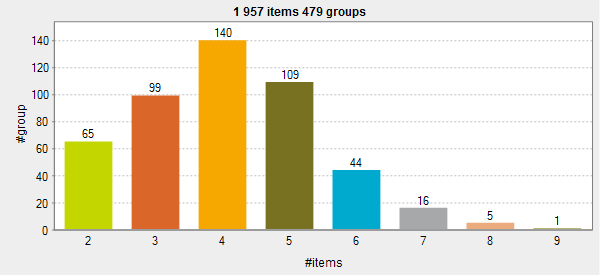
Poisson distribution: The curve is not
symmetrical. The groups of duplicates are distributed unevenly.
Geometric distribution: The form of the curve is
decided by the percentage you set for the duplicated records in the
tDuplicateRow basic settings. The higher the percentage is, the
fewer groups with many records you will have. In this example the
percentage for the duplicate records is set to 80%. This is
why many groups with two-record duplicates are generated (148 groups), while there is only one group that has 14, 15 and 16 duplicates.

 The output schema of this component contains one read-only column, ORIGINAL_MARK. This column identifies, by true or false, if the record is an original or a duplicate record. There is only one original record per group of duplicates.
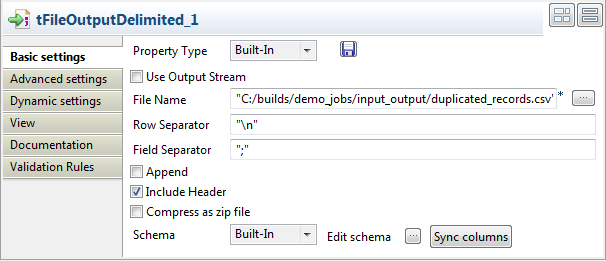
 Some data has been modified in the Name, City and DOB fields according to the criteria you set in the Modifications table and duplicate records have been generated based on these modifications.For example, if you compare the original name Mrs Morgan Ross and the duplicate name Mrs M rganosRiss, you see that the two functions have been used on this duplicate record: the letter o has been exchanged with a space, and also the sound has been replaced in Ross and Riss. However, the soundex code has not been changed for the replaced sound.