
A trend line is a visual representation of the direction of values over a period of time. Trend lines show trends over time, by visualizing the direction of values and how fast the values change.
Which visualizations have trend lines
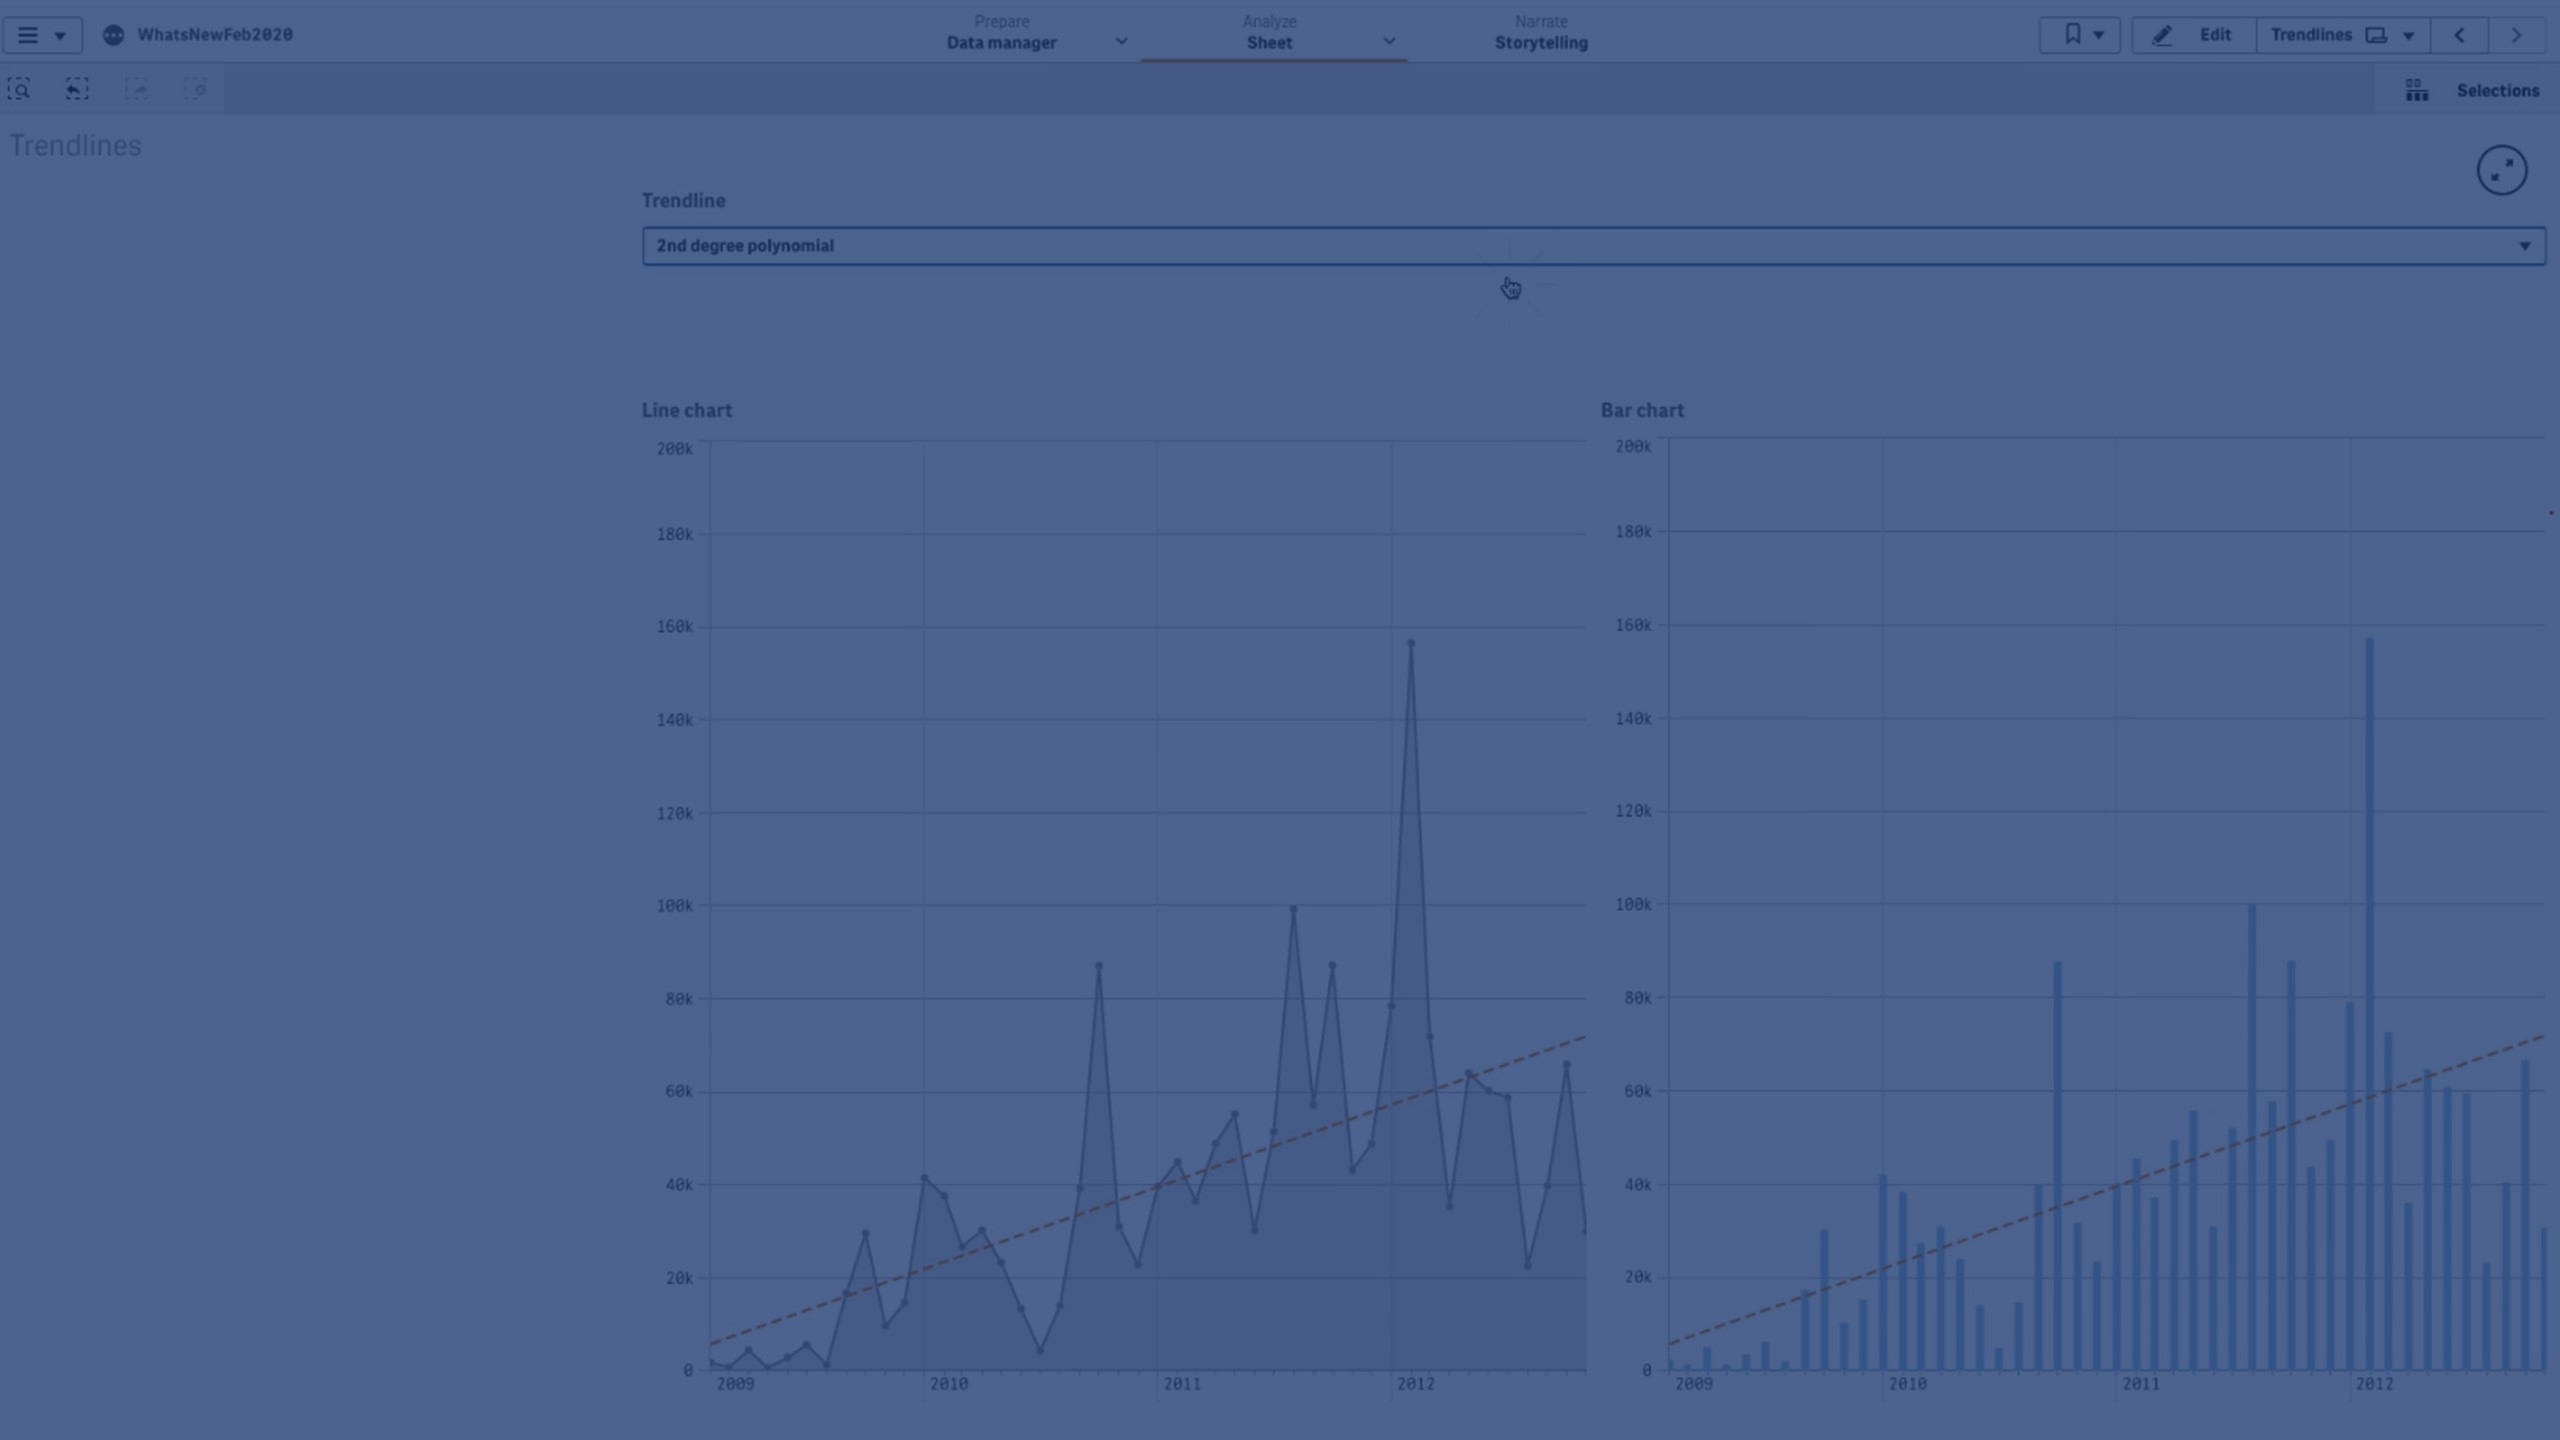
| Visualization | Trend lines |
|---|---|
| Bar chart | Yes |
| Line chart | Yes |
When to use trend lines
A single trend line can be added to a chart to smooth out fluctuations in data, and to show any trends more clearly.
More than one trend line can be added to a chart, showing different types of trends or different values.
Types of trend lines
Average
An average trend line shows the average value of the data, for the time period being analyzed.
A bar chart showing sales per month. An average trend line is shown with a dashed red line.

Linear
A linear trend line shows increase or decrease of values at a steady rate. Linear trend lines are usually used with simple linear data sets.
A bar chart showing sales per month. An linear trend line is shown with a dashed red line.

Polynomial (second, third, fourth degree)
A polynomial trend line is a curved line used on fluctuating data.
The number of data fluctuations can determine the order of the polynomial. A second degree polynomial trend line has one hill or valley, a third degree polynomial trend line has up to two hills or valleys, and a fourth degree polynomial has up to three hills or valleys.
A bar chart showing sales per month. Polynomial trend lines of second, third, and fourth degree are shown with dashed red, yellow, and green lines respectively.

Exponential
An exponential trend line is a curved line used when data values rise or fall at increasingly higher rates.
A bar chart showing sales per month. An exponential trend line is shown with a dashed red line.

Logarithmic
A logarithmic trend line is a curved line used when the rate of change in data increases or decreases quickly, before leveling out.
A bar chart showing sales per month. A logarithmic trend line is shown with a dashed red line.

Power
A power trend line is a curved line used with data sets that compare measurements that increase at specific rates.
A bar chart showing sales per month. A power trend line is shown with a dotted red line.
