Similarly to the Operation assessment, the
Environment Runtime Usage assessment provides a way to connect to
a registered Talend Administration Center instance
and generates a dashboard focused, this time, on the overall Runtime platform usage.
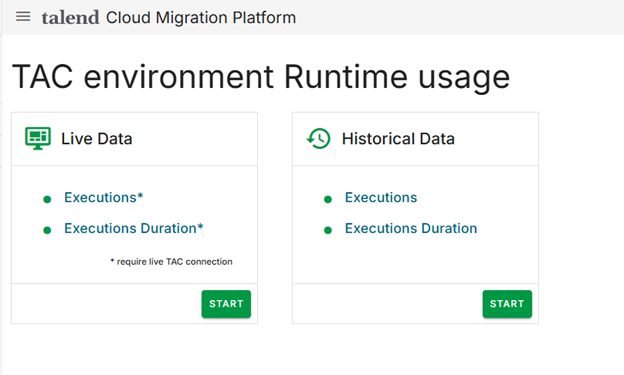
This feature is split into two sub-menus.
Live Data
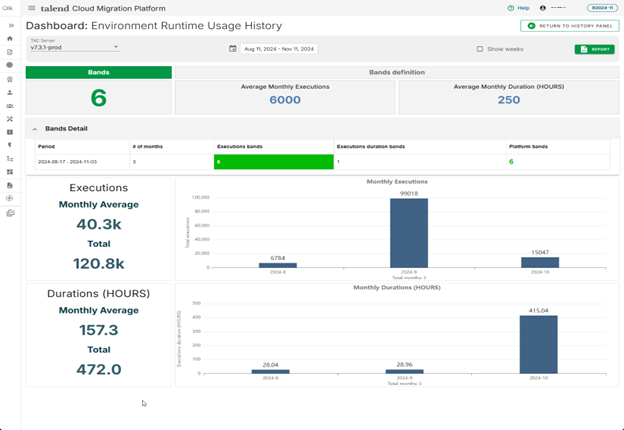
This menu displays real-time information about the platform's current activity, including:
The total number of tasks and Jobs executed, including those within
Execution Plans.
The cumulative execution duration for a selected period.
Breakdown of these metrics by individual Talend Project for more detailed analysis.
For capacity-based usage models, the system also computes the total number of bands,
reflecting the total number of executions and total execution durations according to
predefined capacity definitions.
The above dashboard metrics are related to the Job Conductor tasks. If the TAC server
defines ESB Conductor tasks, an additional button (ESB Tasks)
is displayed in the toolbar:
As the TAC server does not record the number of execution and duration of the ESB
conductor tasks, you can enter manually the estimated monthly execution duration for
each defined ESB conductor task.
The result of total hours is used to better estimate the platform runtime usage and
the corresponding capacity bands.
Historical Data
To facilitate long-term tracking of platform usage, Qlik Talend Cloud Migration Toolkit
offers a scheduled, weekly collection of execution metrics (total executions and
execution durations), which are stored in its internal database. This historical
data allows for a more comprehensive analysis over extended periods, enabling the
dashboard to provide a detailed view of usage trends and patterns over time.
Did this page help you?
If you find any issues with this page or its content – a typo, a missing step, or a technical error – please let us know!