Exploring the results of the numerical correlation analysis
Before you begin
Procedure
Results

From the SQL editor, you can save the executed query and list it under the folders in the DQ Repository tree view if you click the save icon on the editor toolbar. For more information, see Saving the queries executed on indicators.
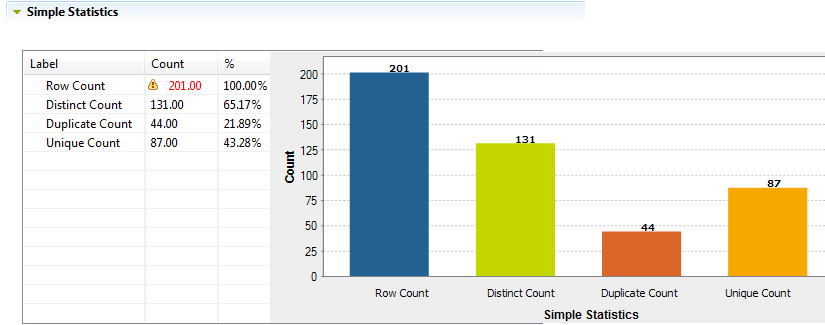
The Simple Statistics view shows the number of the analyzed records falling in certain categories, including the number of rows, the number of distinct and unique values and the number of duplicates.

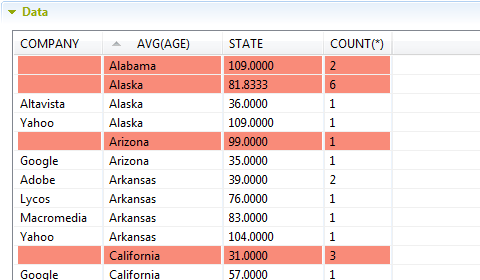
The Data view displays the actual analyzed data.

You can sort the data listed in the result table by simply clicking any column header in the table.

