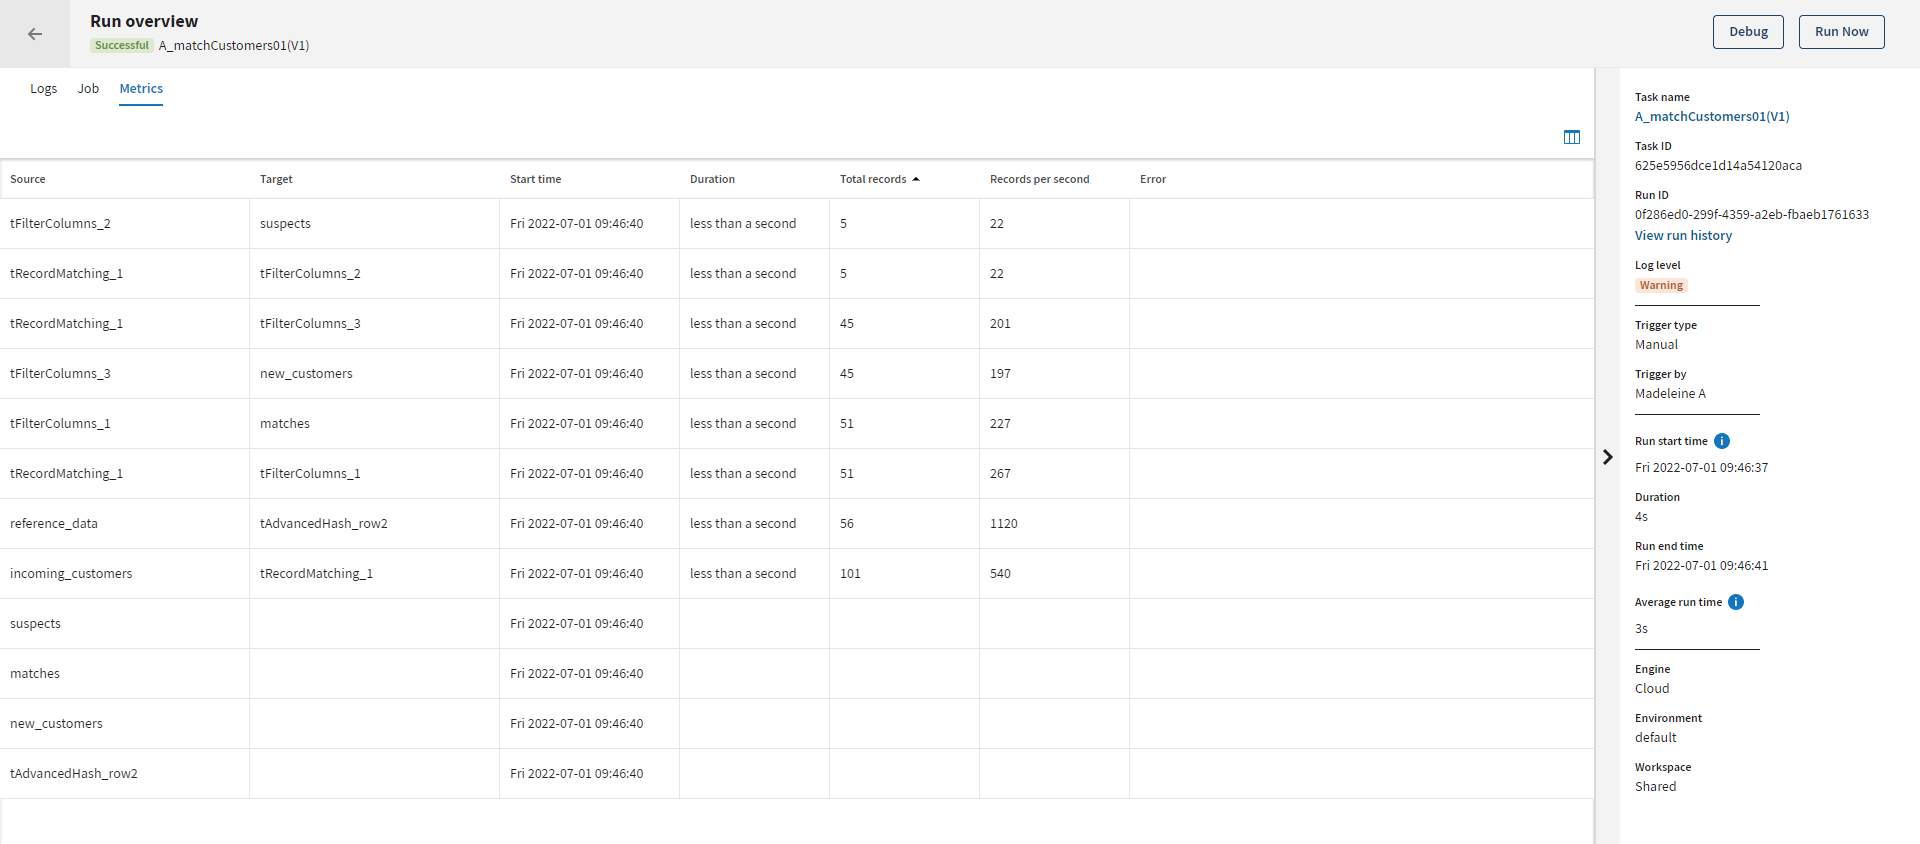
Viewing the component metrics
The Metrics tab from the Run
overview page lets you see information on the Job components, such as
the count of records or the type of the source and target components.
Before you begin
You have published or republished the Jobs with Talend Studio version 8.0.1 or 7.3.1 with the latest update.
This feature is available for Cloud Engine and Remote Engine 2.12.0 onwards.
About this task
Data older than 31 days will be cleared automatically as per our metrics retention policy.
Metrics are automatically refreshed.


 icon in the top-right corner to select what information to display in the
table. By default, the columns