Monitoring capacity usage by executions with detailed consumption reports
With the Data Capacity Reporting App of Qlik Cloud, you can monitor the capacity consumption by the Job executions in Talend Management Console.
The app allows you to monitor the consumption of the monthly capacity for your tenants at both consolidated and detailed levels, gaining insights about how you are consuming the resources of your Talend Management Console accounts or tenants.
This consumption is measured by number of executions and duration of executions, showing current capacity and historical monthly usage.
To use this feature, you must meet the prerequisites and follow the procedure detailed in this section to configure Qlik Cloud and Talend Management Console and generate the reporting app with the consumption data.
This Data Capacity Reporting App does not exist by default, but needs to be regularly generated (distributed in terms of Qlik Cloud), regenerated, and shared by the Qlik Cloud administrator from the Settings page, so as to include the up-to-date information in the report. For further information about the app distribution, see Distributing detailed consumption reports.
Job executions
Job executions refer to Job task runs in Talend Management Console.
The Job Executions page presents your current month's usage of the capacity, overview of historical usage of last 12 months, and detailed usage of up to last 3 months.
Only started executions are taken into account for this measurement. Therefore, an execution that fails to deploy does not count. For the started executions, those with the Failed status (DEPLOY_FAILED and EXECUTION_FAILED in API responses) are also excluded from the measurement, thus consuming none of your capacity.
-
Usage overview:
The bar charts provide a consolidated overview of all your tenants, without the option to filter them by individual tenants.
As indicated in the legend of the charts, the dotted line represents the maximum capacity you expected to consume, and any part of the bar that exceeds this line turns red.

Detailed view:
For detailed usage, you can filter information by months, tenants, environments, workspaces, and engines.

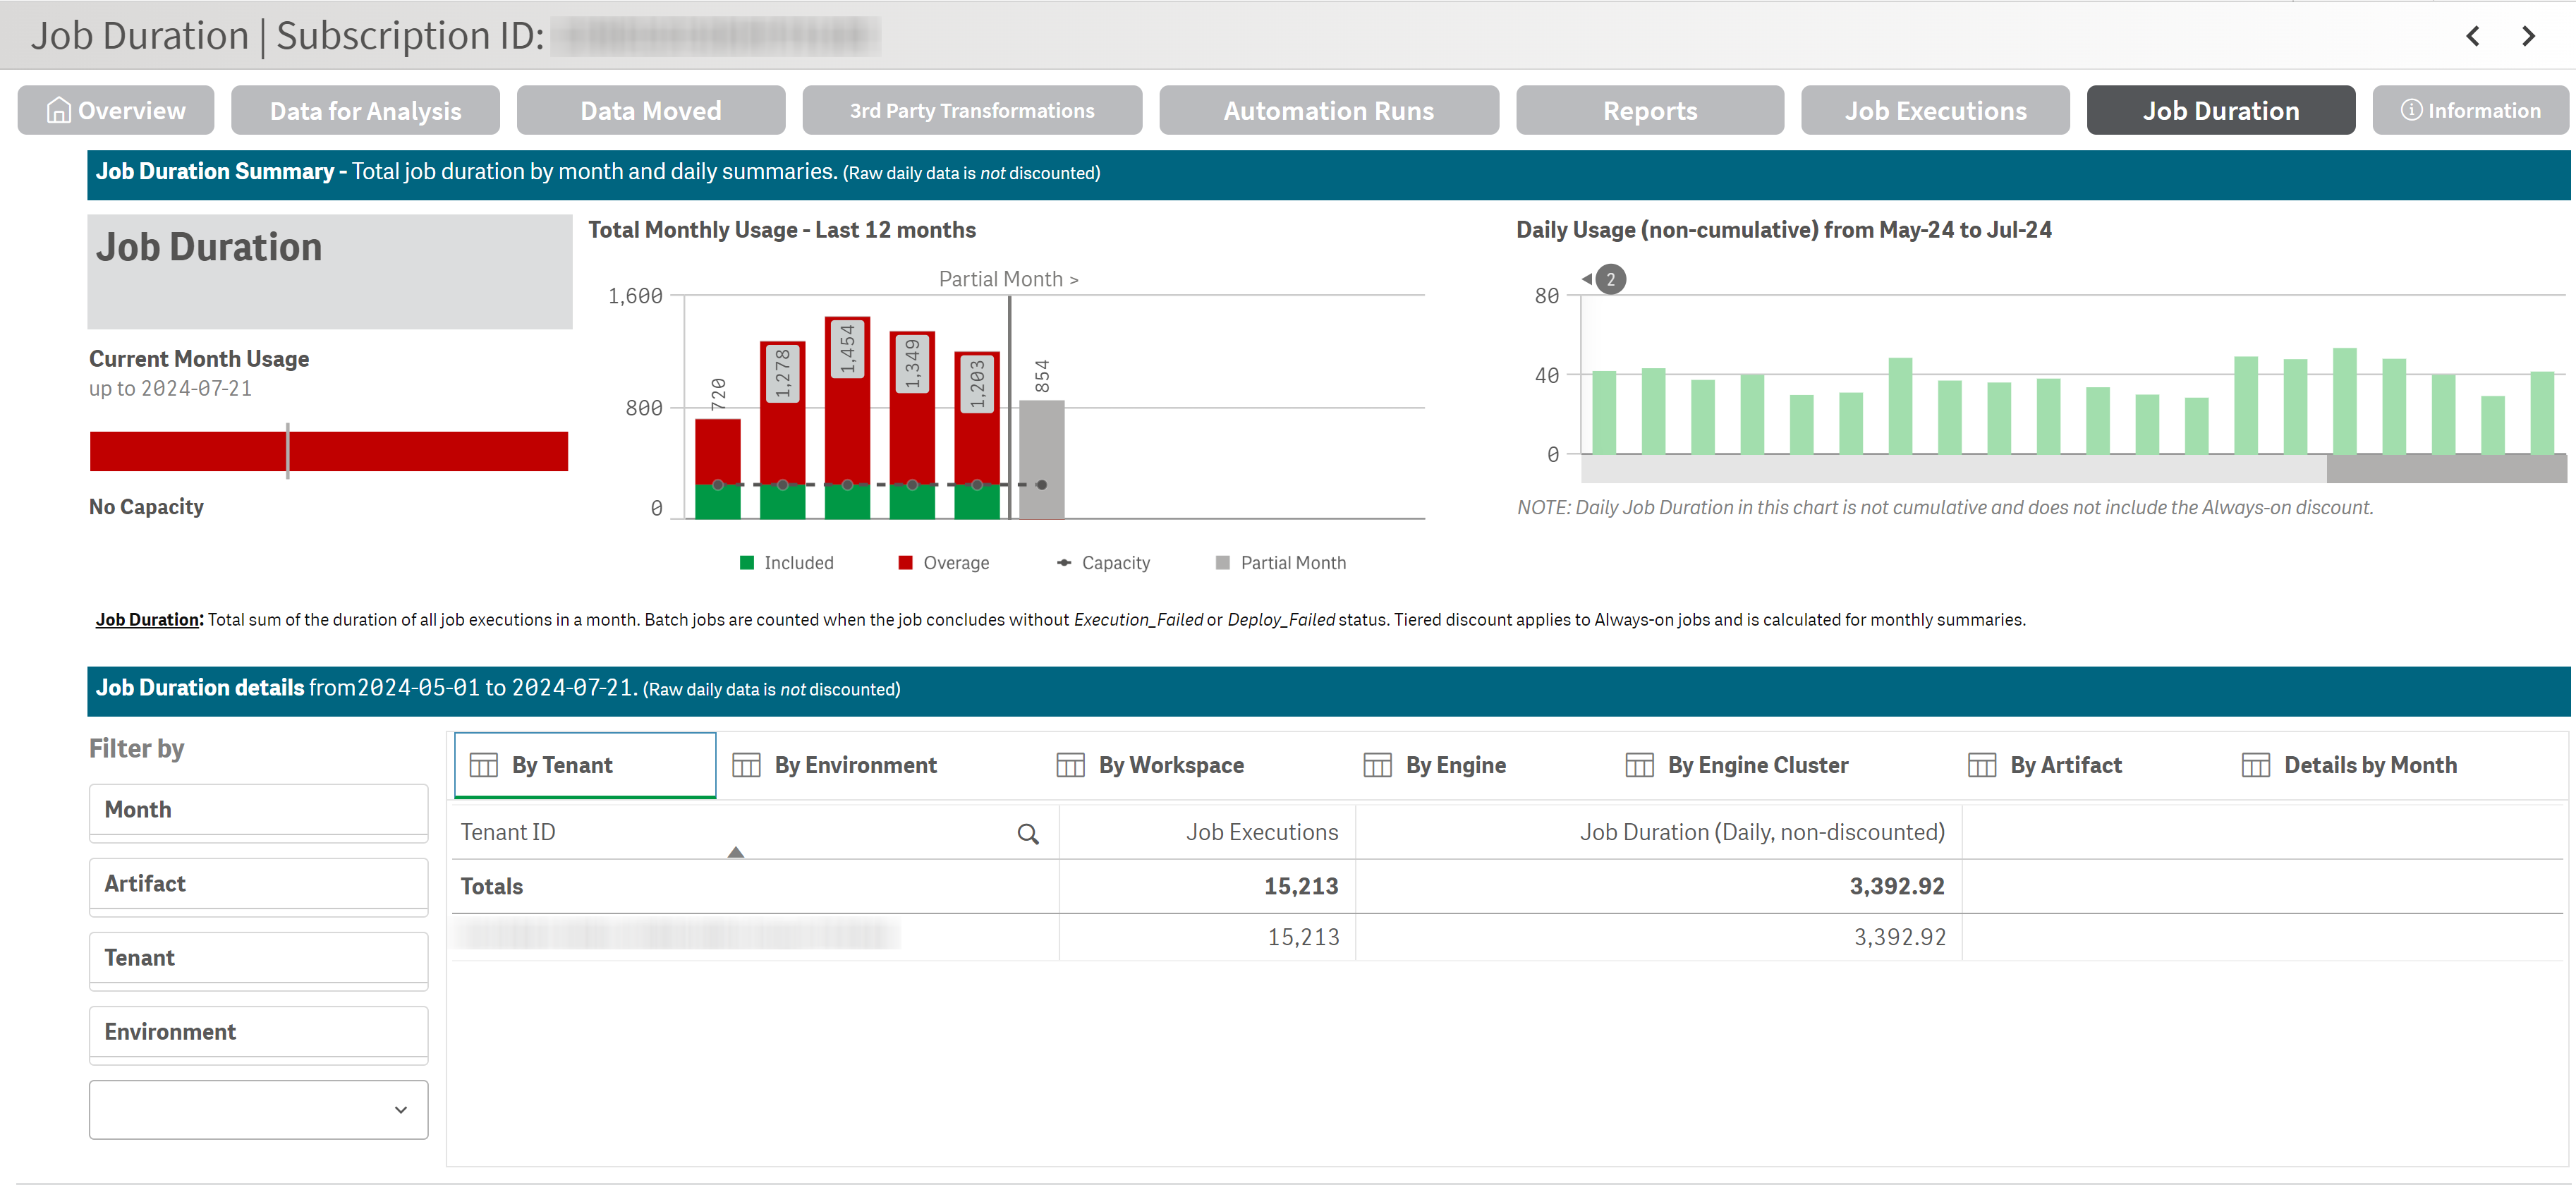
Job duration
Job duration refers to the execution time of a Job task in Talend Management Console.
Along with Job executions, the total duration of your Job executions also serves as a value meter to measure your monthly capacity consumption.
- Only the failed punctual executions are excluded from the measurement. Streaming Jobs, including Routes, data service Jobs, and Spark streaming Jobs, are always taken into account. A failed streaming Job task is considered to be completed.
- The measurement for streaming Jobs is adjusted at the end of each month. This means you see the actual duration consumption by these Jobs during the ongoing month, but only 10% of that consumption is ultimately counted towards your capacity usage when the month ends.

