New archived content: Talend MDM, Talend Data Catalog 8.0, and Talend 7.3 products reached their end of life in 2024. Their documentation was moved to the Talend Archive page and will no longer receive content updates.
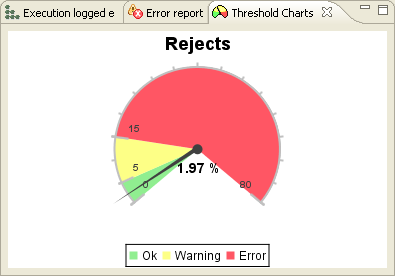
The Threshold chart view displays the proportion of the flow
measured.
The chart displays a speedometer showing various thresholds that you defined on the
tFlowmeter component, helping to visualize the acceptable or non
acceptable flow volume thresholds.
Did this page help you?
If you find any issues with this page or its content – a typo, a missing step, or a technical error – please let us know!