
Job Volume view
The Job Volume view displays a line chart representing the volumetrics of the flow being processed. Depending on the tFlowMeter component settings on your Talend Job design, the scale and units will differ.
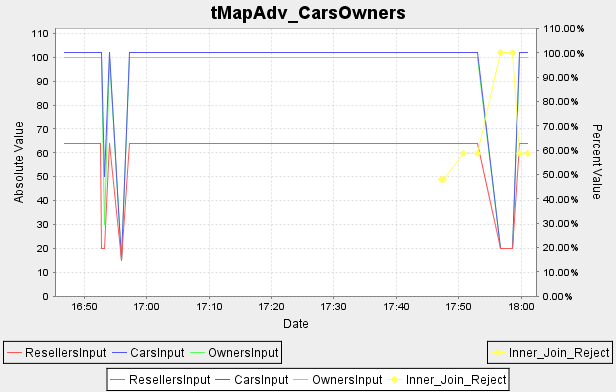
Each flow tracked down using a tFlowMeter component will be displayed in a different color on the Job Volume chart. The Relative Value flows depend on the Percent Values axis showing on the right side of the chart whereas the Absolute Value flows follow the left range axis.