Skip to main content Skip to complementary content

Accessing the monitoring console from Talend Administration Center (deprecated)

Availability-noteDeprecated

About this task

Information noteNote: In Talend Administration Center, Talend Activity Monitoring Console is a Web application that has to be deployed in the Tomcat server before it can appear in the Talend Activity Monitoring Console menu. For more information, see the Talend Installation and Upgrade Guide.

You can monitor your Talend Job activities from Talend Administration Center when database tables are used as the datasources.

To access Talend Activity Monitoring Console through the Talend Administration Center interface for the first time, proceed as follows:

Prerequisite: Make sure that the AMC URL has been defined on the Configuration page of Talend Administration Center before. For more information, see Talend Administration Center User Guide.

Procedure

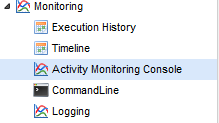
  1. In Talend Administration Center, expand the Monitoring node. Then, click Activity Monitoring Console.

    Example

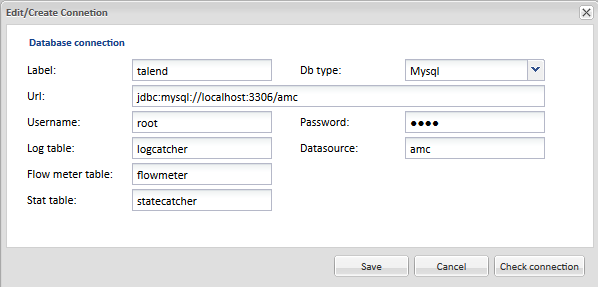
  2. Next to the Connections list on the Activity Monitoring Console page, click the [+] button to open the Edit/Create Connection configuration window.
    Later, you can click to edit the connection or to delete the connection if needed.
    Information noteWarning: By default, the Monitoring node allows you to connect to the MySQL database. If you want to establish a connection to any other database, you must first put the corresponding jar file in the Tomcat lib folder. Otherwise, your database connection cannot be initialized.

    Example

  3. Enter the relevant connection information.

    Field

    Description

    Label

    Name of the connection entry in the connection list.

    DB type

    The database type to which you want to connect.

    URL

    URL address the server hosting the log database, including the host, port and the name of the log database to connect to.

    Datasource

    If required, set the data source for the selected database.

    Username

    Login name to the database.

    Password

    Password to the database.

    Log table

    Name of the table gathering the information caught through the tLogCatcher component in the Job.

    Flow meter table

    Name of the table gathering the information caught through the tFlowMeterCatcher component in the Job.

    Stat table

    Name of the table gathering the information caught through the tStatCatcher component in the Job.

  4. Click Save to add the database connection to the Connections list. You can click Check connection to test the database connection or click Cancel to close the window without saving any changes.
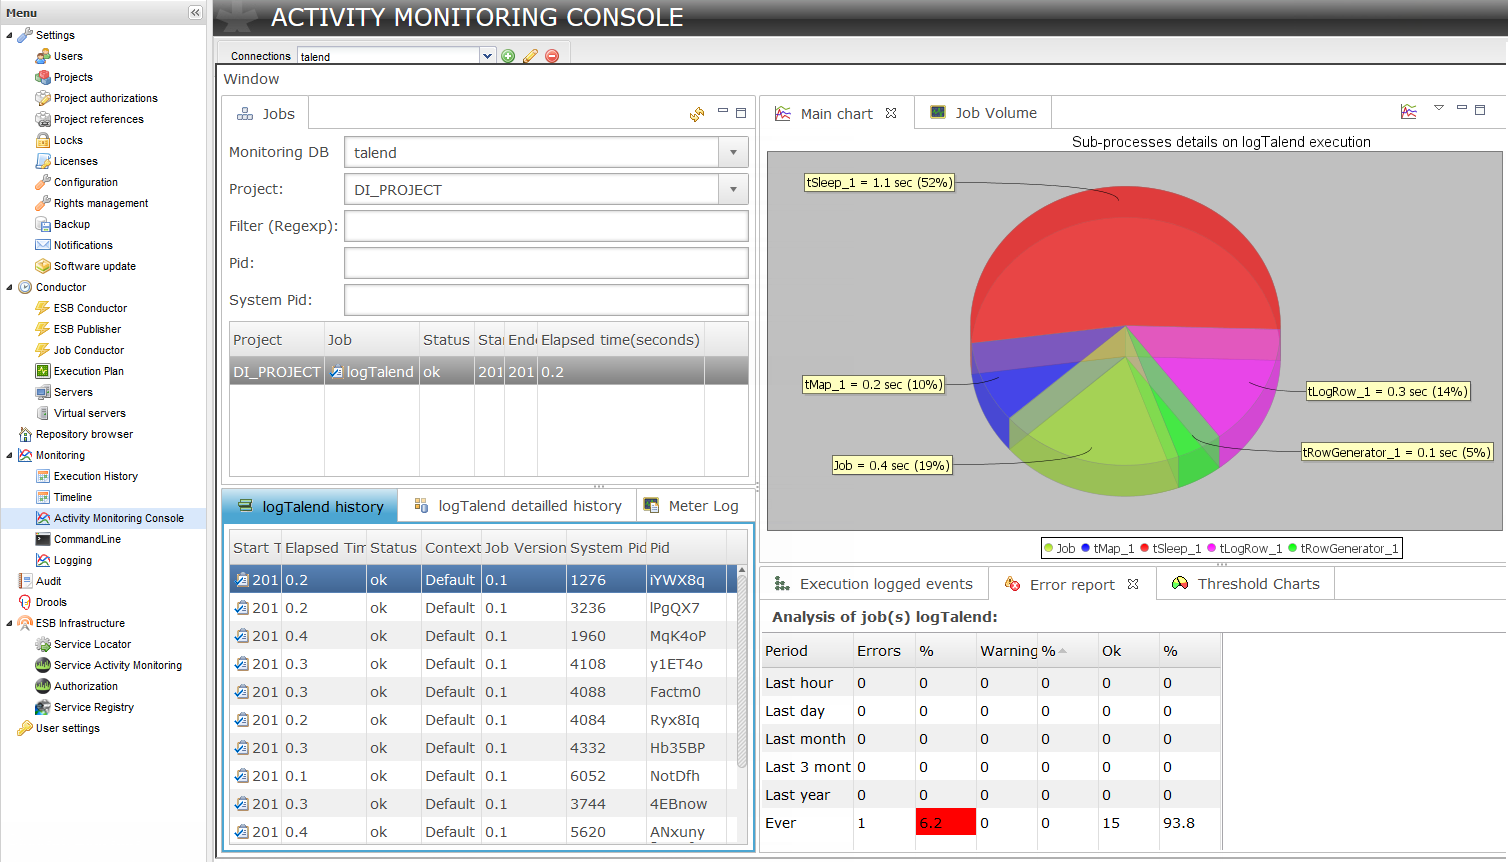
  5. Select the connection from the Connections list. The corresponding view is displayed with the connection.

    Example

Results

If more than one connection exists in the Connections list, select the active connection of the database where you save the log tables and then view the monitored information.

For more information about the various monitoring views, see GUI of the monitoring console.

Did this page help you?

If you find any issues with this page or its content – a typo, a missing step, or a technical error – please let us know!