Selecting and loading data
Loading data from files, such as Microsoft Excel or any other supported file format, is easily done by using the data selection dialog in the data load editor.
Do the following:
- Open Qlik Sense.
- Create a new app.
- Name the app Scripting Tutorial, and then click Create.
- Open the app.
- Open Data load editor from the drop-down menu in the top toolbar.
-
Click
in the left menu to add a new script section below the section named Main.
- Give the section a name by typing Sales.
-
Expand the Data sources panel if not already expanded. A menu appears on the right.
-
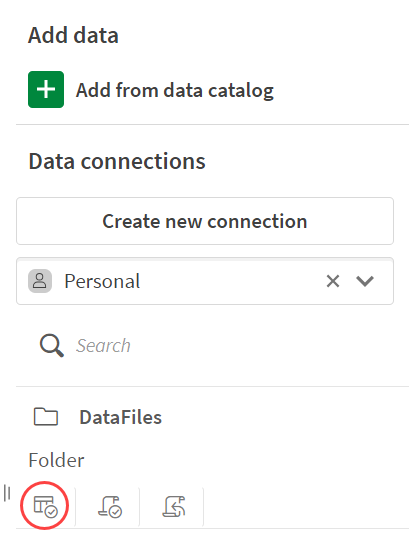
Under DataFiles in the right menu, click Select data.
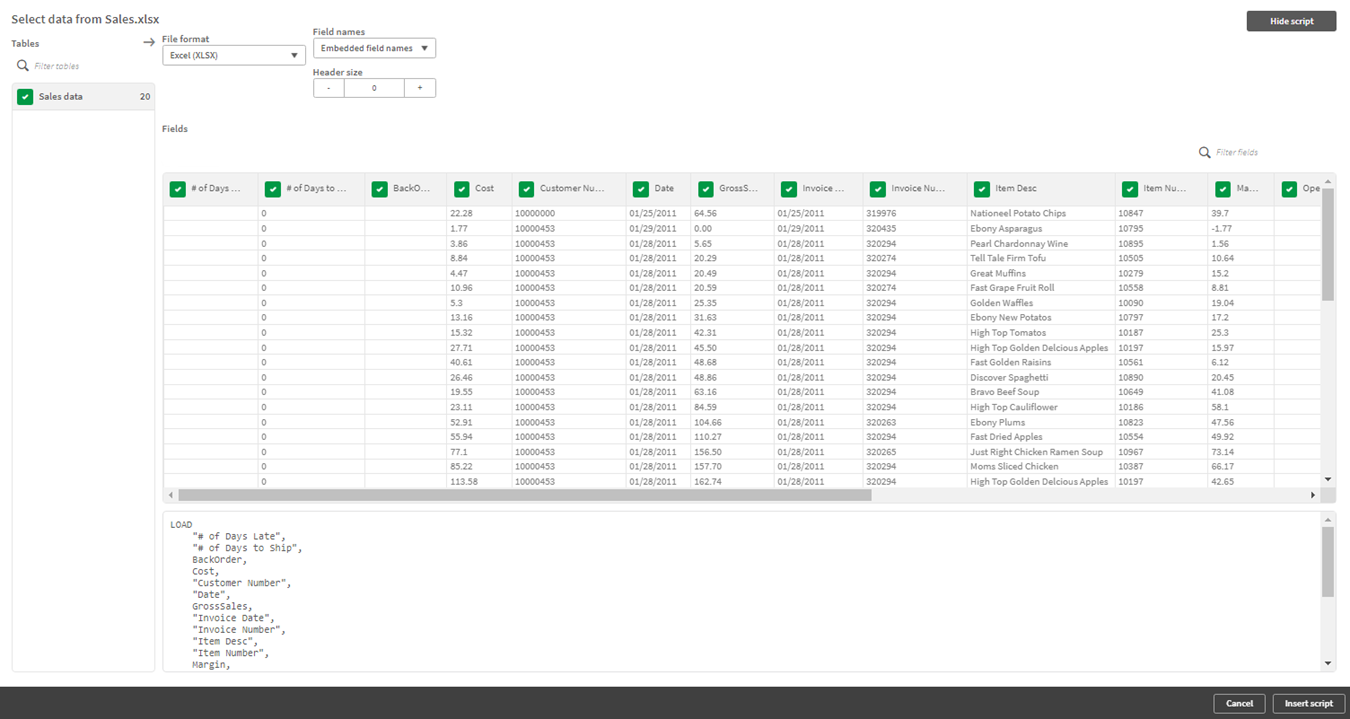
- Upload and then select Sales.xlsx. A data preview window opens.
- Deselect the fields # of Days Late and # of Days to Ship. You might need to click on the field headings to see the complete field names.
- Search for date in the Filter fields search field.
- Click on the heading Invoice Date and type Bill Date to rename the field.
- Click Insert script. The load script is inserted into the Sales section of the script editor. Note that Qlik Sense puts double quotes around field names that contain a space.
- Add the following row above the LOAD statement to name the table Table1:
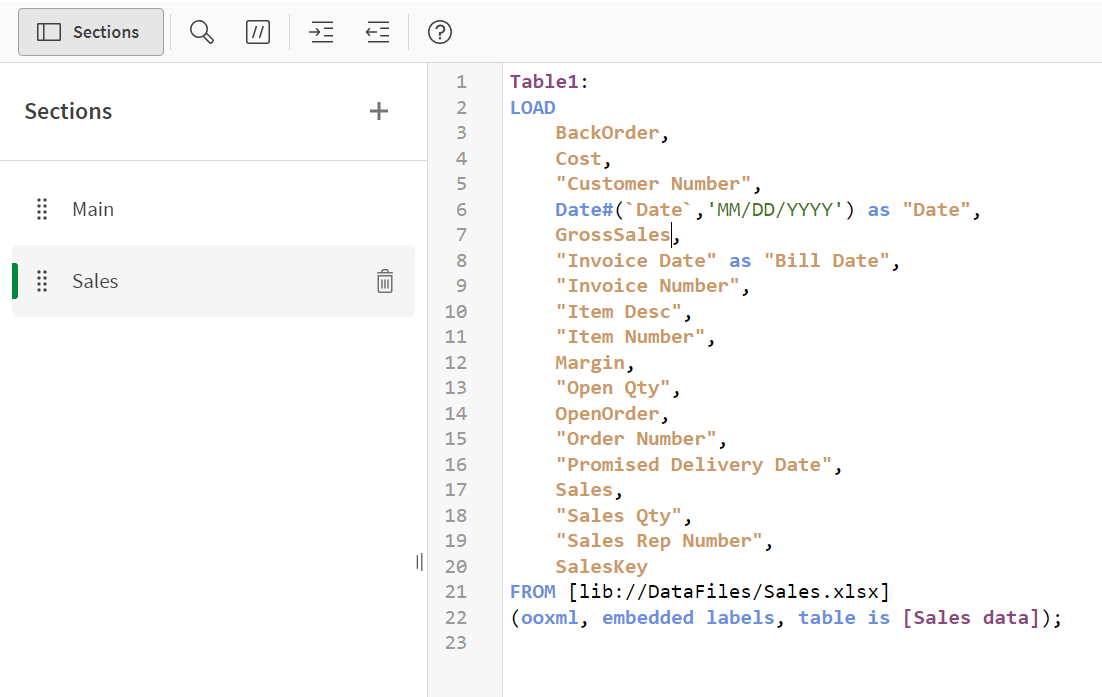
- Now adjust the script to ensure that the dates are interpreted correctly. Change the Date field to the following:
- In the upper right corner, click Load data.
- Click Close.
- Open the data model viewer from the drop-down menu in the top toolbar. By clicking
the data model viewer will open in a new tab.
- Select
and
in the top menu to show the table view that is used in this tutorial. If your table is not displayed properly, you can remove the existing load script and build the script again.
- Open the Data load editor.
- Click
to add a new script section.
- Name the section Dates. If the new section Dates is not already placed below Sales, move the pointer over
, and then drag the section down below the section Sales to rearrange the order.
-
Click on the top row of the script and click
.
Make sure // is added into the script.
- Add the following text after //:
-
Under DataFiles in the right menu, click Select data.
- Upload and then select Dates.xlsx. A data preview window opens.
- Click Insert script.
- Add the following on the row above the LOAD statement to name the table Table2:
- To ensure that the Month column in the file Dates.xlsx is interpreted correctly in Qlik Sense we need to apply the Month function to the Date field.
- In the upper right corner, click Load data.
- When the script execution is finished, click Close.
- Open the Data model viewer.
- Click Preview in the bottom left corner. Click on the name of the table Table2.
Using more than one section makes it easy to keep your script organized. The script section will execute in order when you load data.
New Sales tab in Scripting Tutorial app
Select data window
Data preview window for Sales data file
Your script should look like this:
Load script in Sales tab
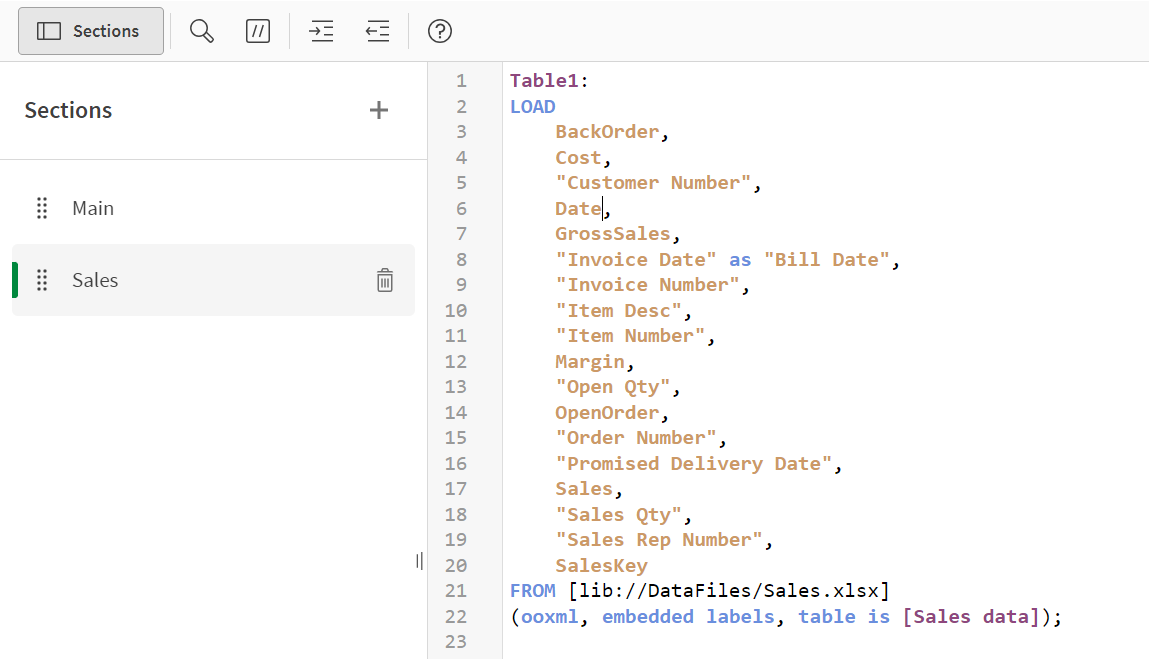
Table1:
Date#(`Date`,'MM/DD/YYYY') as "Date",
Your script should look like this:
Updated load script in Sales tab
This will load the data into the app. A script execution progress window is displayed. When it is finished you will see a summary of possible errors and synthetic keys even if there are none.
Table view in data model viewer of Sales data

Now, let's load another table called Dates. After we load the table, Qlik Sense will connect it with the Sales table on the Date field.
Loading data from Dates.xlsxThe top line of your script should now look like this:
// Loading data from Dates.xlsx
Data preview window for Dates data file
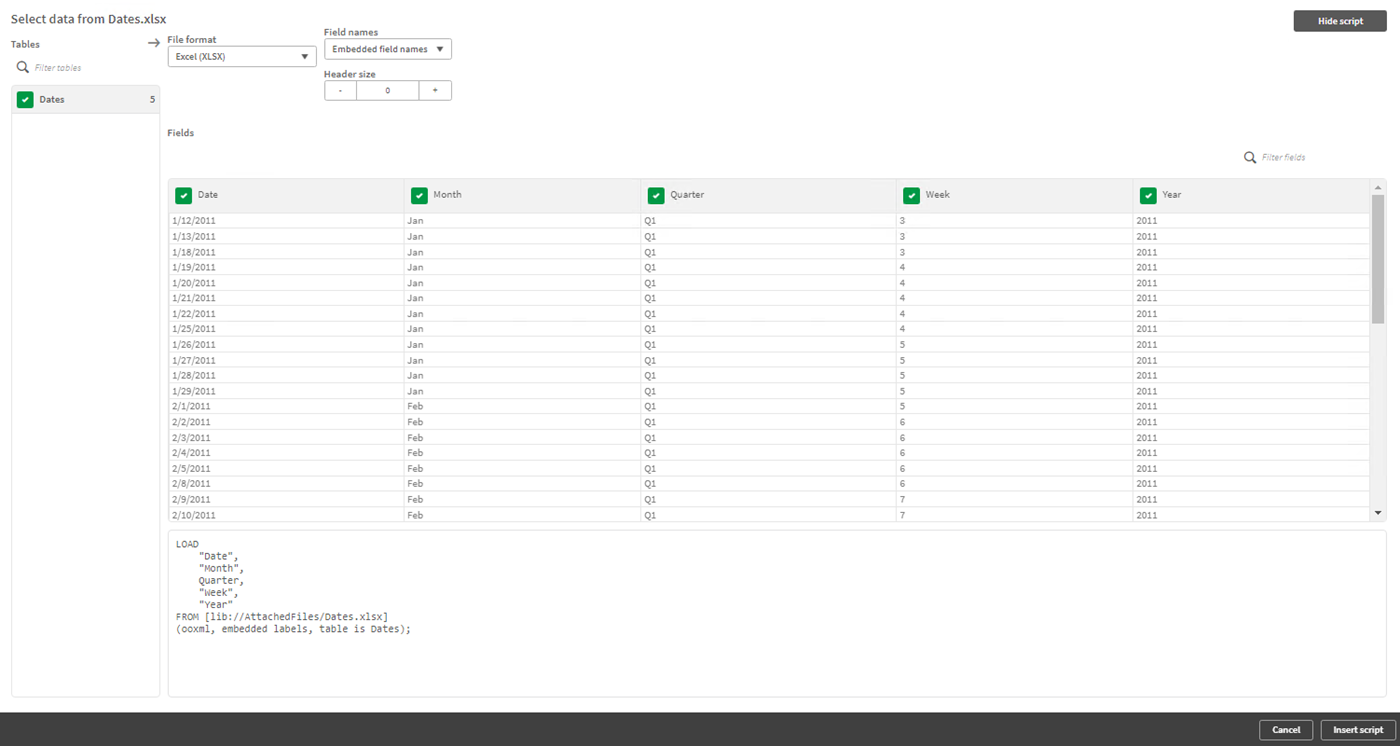
Your script should look like this:
Load script in Dates tab
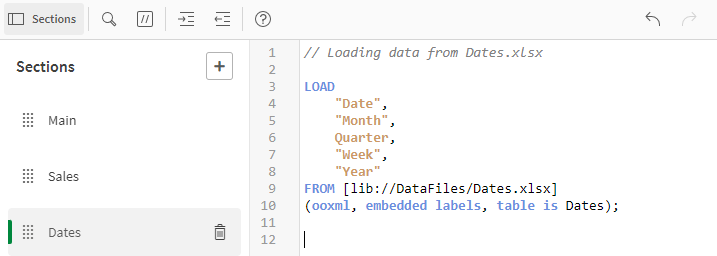
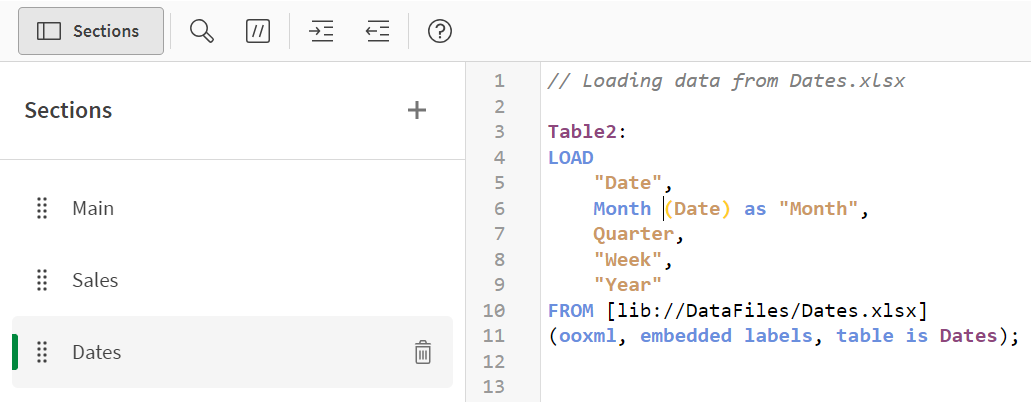
Table2:Change the Month field to the following:
Month (Date) as "Month",
Your script should look like this:
Updated load script in Dates tab
Now you have created a script to load the selected data from the file Dates.xlsx. It is time to load the data into the app.
When you click Load data, the data is loaded into the app and the script is saved.
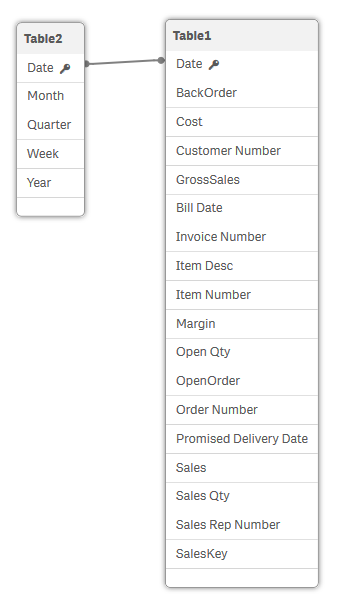
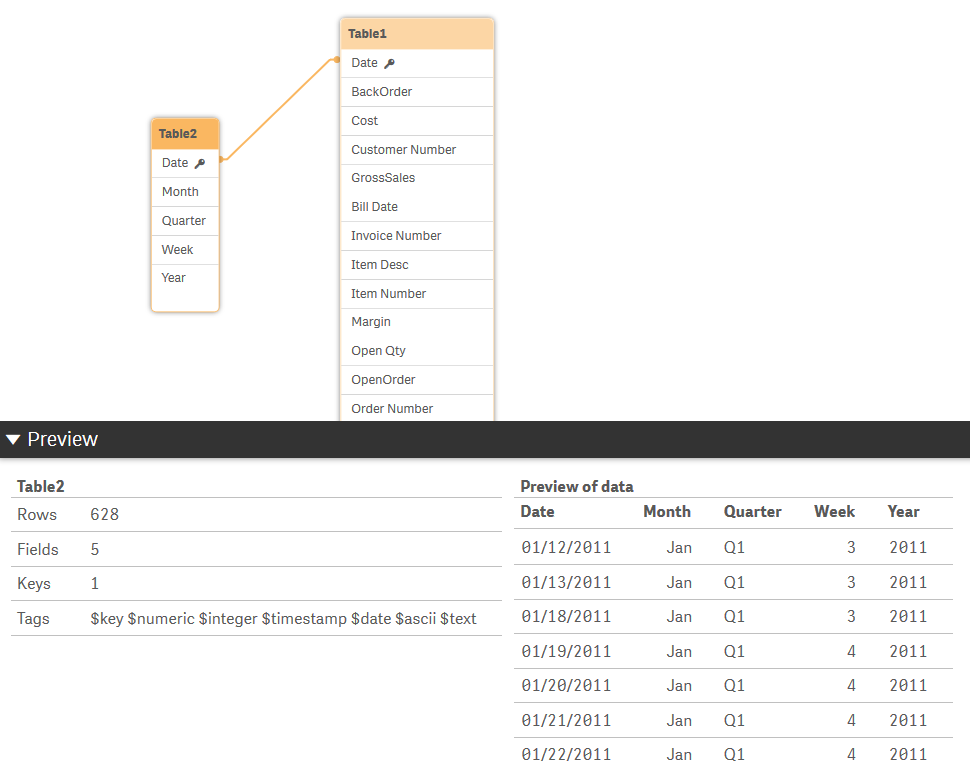
Now you can see that a connection has been made between the two fields named Date in the two tables.
Table view in data model viewer
This will display information about the table. In the Preview field you can see that 628 rows of data have been loaded into the internal table Table2. If you instead click on a field in the table, you will see information about the field.
Table preview in data model viewer
The data is now available to use in visualizations in an app. We will show you how later in this tutorial.
