Managing dataset metadata
Catalog provides several layers of key descriptive and technical metadata about datasets. This information assists in the organization and assignment of resources and access.
App developers use profile statistics and data sampling to gain ideas and direction for creating apps and planning visualizations. Field profiling can help data analysts and business users to gain insights faster without having to create an app first. Whether you are a data administrator or a data consumer; knowing the provenance of your datasets and trusting in the accuracy of metadata increases trust and confidence when analyzing data assets.
Dataset overview
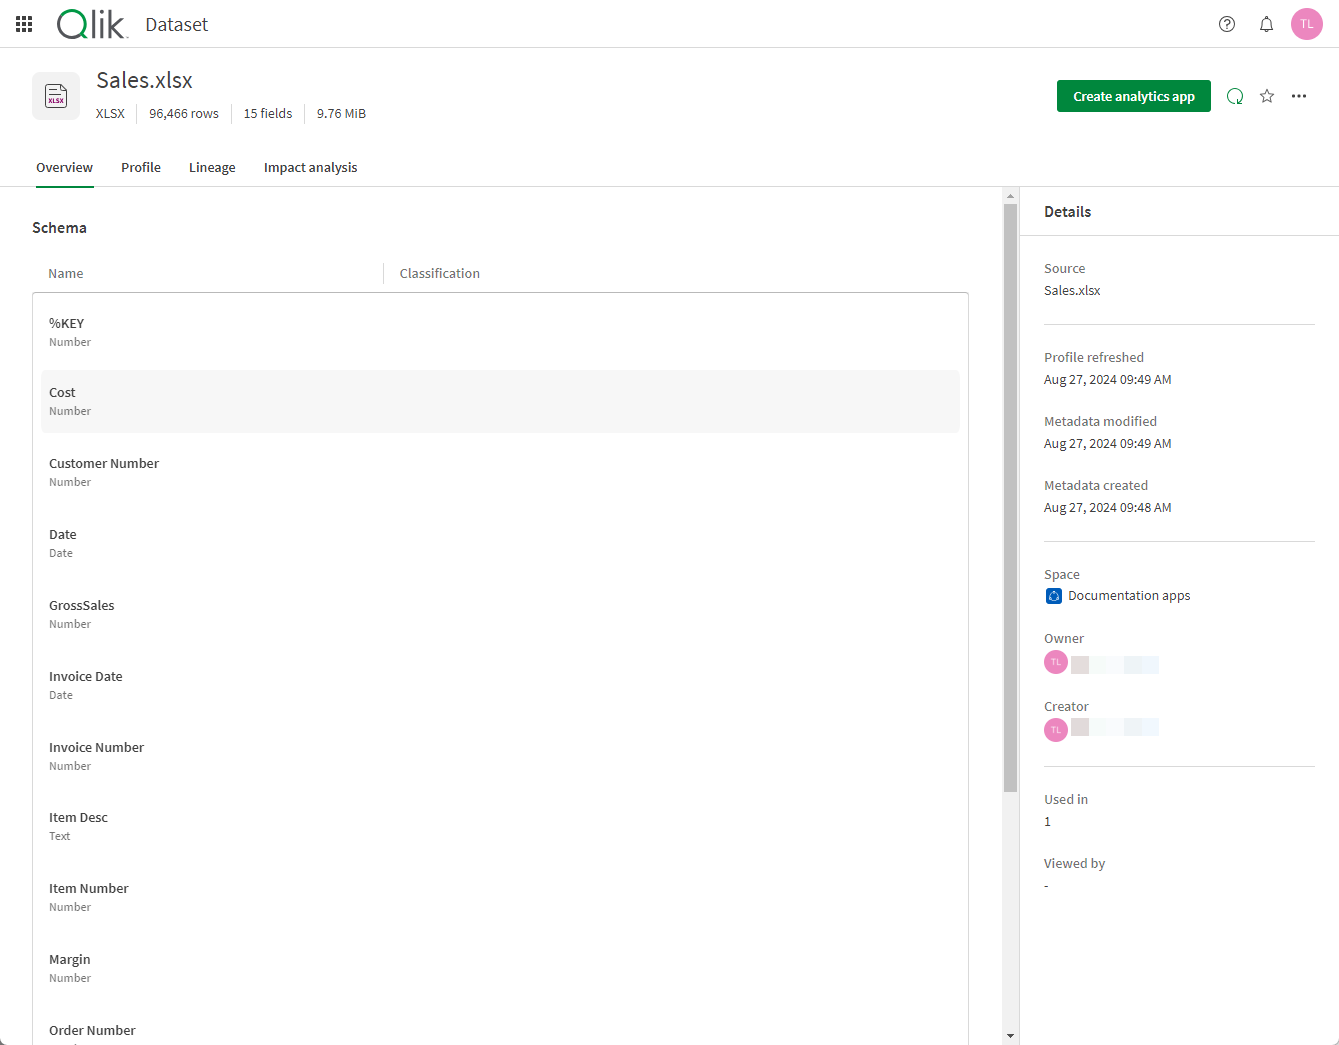
The dataset Overview tab provides a summary of descriptive and technical metadata about your datasets.
The overview tab captures:
- Technical metadata such as size, owner, file type, and created, last modified, and metadata refresh timestamps. Metatags that have been applied to the dataset display above this information.
- Classifications are applied to datasets to associate them with user-defined logical subject areas.
Do the following:
-
From the Home tab in Qlik Cloud Analytics, select the Catalog icon on the left hand navigation bar; or from the Catalog tab, filter on Types: Data.
When hovering over a dataset tile, the data file extension icon (example: .XLSX) changes to an Open dataset button. The source file name displays below it. Datasets inherit the name of the original data file and can be edited.
-
Select Open dataset to display an Overview of that dataset.
Dataset overview lists technical metadata. Tags applied to the dataset and classifications for dataset and fields display.

The heading of the dataset provides the following metadata:
| Metadata | Description |
|---|---|
| Type | The type of dataset, such as delimited or XLSX. |
| Rows | Number of records in the dataset. |
| Fields | Number of columns in the dataset. |
| Size | File or content size (example: 9.51 MiB) |
Details provides the following metadata:
| Metadata | Description |
|---|---|
| Tag | Metatags that have been applied display (example: tag1, tier3, upgrade, and so on). |
| Source | Original data resource name (example: MyVolumes.txt). |
| Profile refreshed | Timestamp of latest refresh of metadata derived from the source of the dataset, such as the profile, the number of records, and the number of columns. |
| Metadata modified | Timestamp of the last modification made (example: Feb 18, 2022 7:21 PM). This value changes when the following events occur: Reload, rename, change description, change owner, change script. |
| Metadata created | Timestamp of dataset object creation (example: Feb 18, 2022 7:21 PM). |
| Space | The linked name to the destination space . Depending on permissions, the space could be a Personal, Shared, Managed, or Data space. |
| Owner | The owner of the content (example: JS Jan Smith). |
| Creator | The creator of the content (example: JS Jan Smith). |
| Used in |
The number of applications using a particular dataset. |
| Viewed by |
The number of unique viewers over the last 28 days. |
Refreshing metadata
Dataset metadata in the catalog adheres to a last-known state metadata management model. This model provides information and actions so that you will always know how up-to-date your derived metadata are. Derived metadata reflects the state of your data and is distinct from user- and system-controlled metadata.
Derived metadata is updated when new added data is profiled on import or when a refresh is manually triggered. Click Compute to refresh derived metadata. The field Metadata refresh date provides the time of the last derived metadata refresh.
If there is a change to the data—for example, if data is added or deducted—Modified date will change but Metadata refresh date will not change because there was no change to the derived metadata.
Tagging datasets
Tags (also known as metatags) are applied by users to assist in locating and organizing data. Data contributors enter and apply free-form tags to datasets for improved search and categorization. This is a useful tool for data administrators who need to filter on particular types of data assets for many reasons, including allocation of cost center resources, segmentation of sales and marketing organizations, and permissions and governance strategy. App developers and data consumers use tags to identify datasets for improved efficiency and organization.
Metatags that have been applied to a dataset display directly above detailed metadata in the overview tab.
Applying metatags to datasets
Do the following:
-
In an open dataset, click
> Rename
Alternatively, in catalog, click
on the dataset and select Rename.
A box appears where the dataset Name, Description, and Tags can be edited. Tags that have already been applied to the dataset appear in the list.
-
In the Tags box, enter tags made up of any character string (spaces and special characters are allowed with a limit of 31 characters across multiple tags). Enter each tag separately then Save the new tags. Individual tags can be deleted by selecting x on the tags.
Filtering on metatags
Do the following:
-
Open the Catalog tab if it is not open. Under the Types dropdown, select Data.
-
Select All filters to open the left-side Filters panel; scroll to the bottom and enter Tags on which to filter datasets.
Configuring dataset classifications
Classifications can be applied to datasets to associate them with specific user-defined subject areas. Classifications can be a valuable tool for identifying sensitive information or simply distinct subject areas.
Do the following:
-
From the dataset Profile tab, locate the Classifications section and select either Personal information or Sensitive information.
