Lineage Tree

The Tree Presentation provides a textual and hierarchical tree presentation, one for each direction (e.g., source and destination). The scope of that list is based upon the choice of direction of the trace which are impact (forward) or lineage(sources) or the business intelligence (BI) reports, as well as the proximity in the trace. It is generally the most efficient to render in the UI.
Please see the discussion on handling large diagrams.
Select the Tree tab on the left to obtain this presentation.
Next to SHOW, you will see two options, Objects or Processes:
- Objects data store object types, e.g., tables, columns, views, fields, files, etc.
- Processes data movement and possibly transformation processes, e.g. mappings, transformations, computation, select/inserts, etc.
The scope of that list is based upon the choice of direction of the trace which are impact (destinations) or lineage (sources), as well as the proximity in the trace:
- Adjacent objects/processes in the lineage which are the next items in a lineage trace. For impact, that can often be the data store (like a warehouse) that is the target of an object being loaded by DI/ETL that is the focus of the lineage. For course lineage, it can often mean the data source directly loaded from to produce the object that is the focus of the lineage.
- Ultimate end objects/processes are the final nodes in the lineage where the trace stops. For impact, this often means report fields, for source lineage it often means operational system tables and columns.
- All objects/projects in the lineage which are part of the business intelligence type reports generally at the far end of the lineage trace.
Steps
- Trace data flow lineage.
- Click the TREE next to Display As on the right.
- From here you may
- Pick the options next to SHOW in the upper left, as defined above.
- Click the Download icon to download the entire textual results to CSV format.
- Expand the details panel to see an equivalent of the Overview tab for the object page of a selected object or process.
Example
Lineage Tree Objects
Search for the DW Staging.Customer table, go to the object page and then the Data Flow tab. Click the Tree tab on the left. Click Objects and Ultimate next to SHOW.
The Lineage (Sources) panel shows the Customer table in the Accounting.MITI-Finance-AR datastore along with the two files in the Data Lake, which together comprise the ultimate sources for this Customer table in Staging DW.
The Impact (Destinations) panel shows the ultimate reports using data from the Customer table.
Click Adjacent.
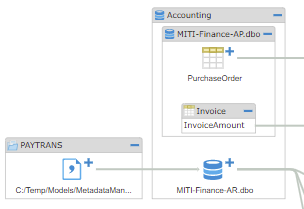
The Lineage (Sources) panel still shows the Customer table in the Accounts Receivable model as it was not only the ultimate source for this table in Staging DW, but also was the adjacent one.
The Impact (Destinations) panel shows the tables in the Dimensional DW data store, instead of going to the ultimate destination, which were the reports.
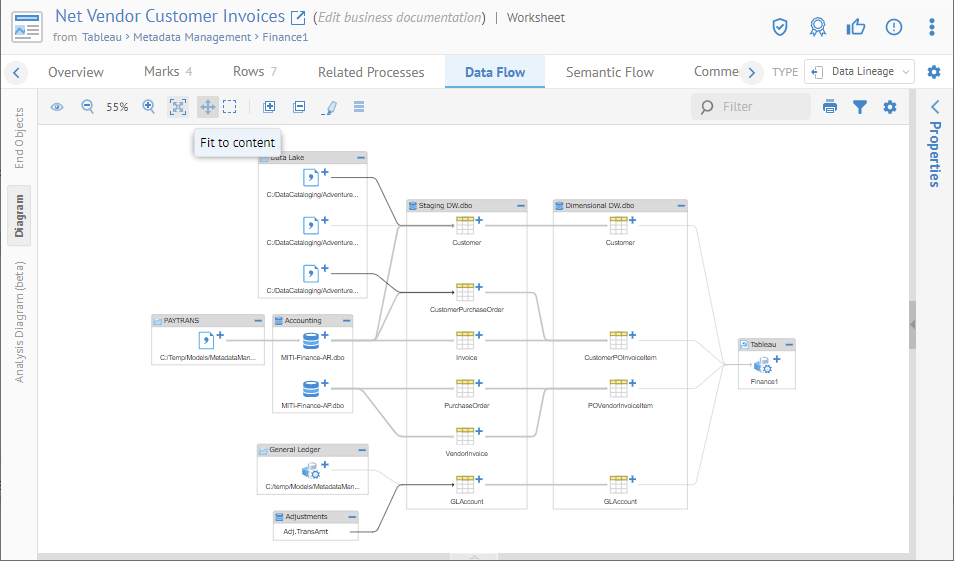
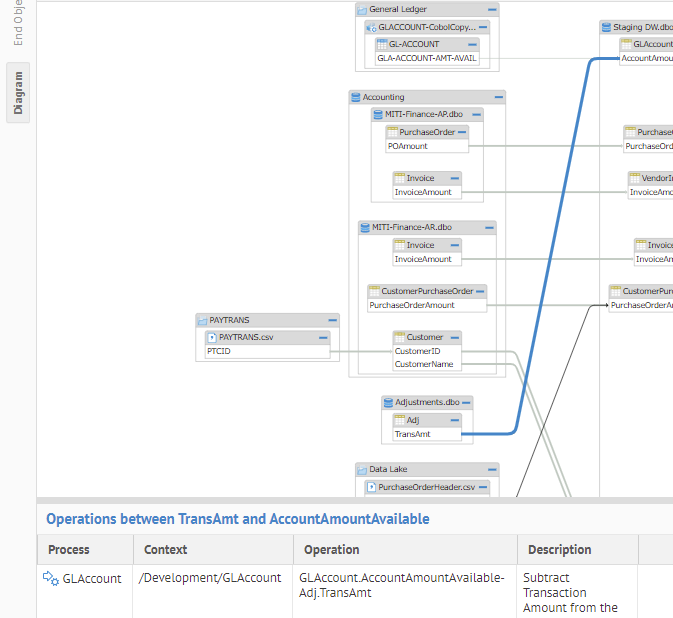
Now, click the Diagram tab on the right to see the full picture of the lineage.
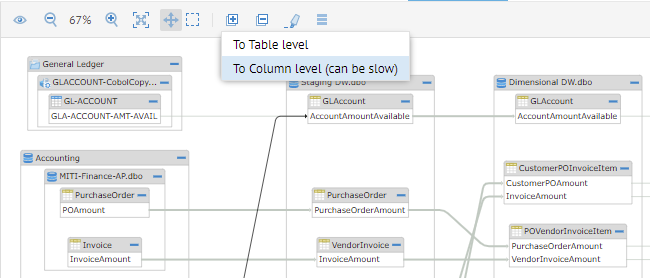
Now, one can see that why the similar results on the Lineage (Sources) panel as there is really only one step (adjacent) to the ultimate sources.
This example is a fairly simple demo. One can imagine the value of using the Tree tab for more realistic (and then much more complex) lineage examples from real environments.
Return to the Tree tab and click Ultimate.
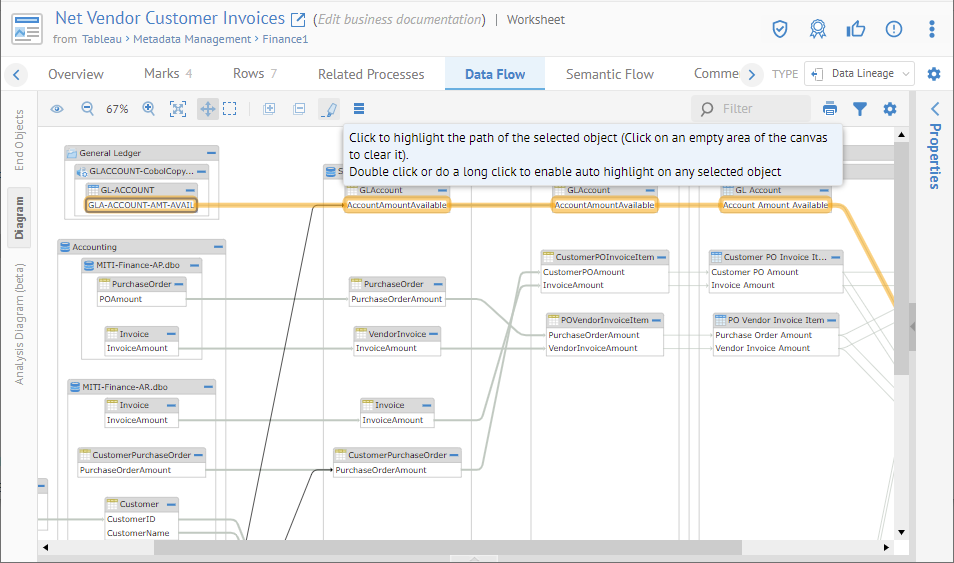
Expand the Details panel on the far right and select the Finance1 app in the Qlik Sense Cloud model.
Now we see a representation of the contents of the Overview tab of the object page, but presented as a panel in the lineage display.
You may now click on the Open in Tool as in the examples with BI tools further in the user guide.
