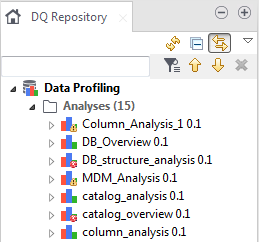
Icons appended on analyses names in the DQ Repository
When you create any analysis type from the Profiling perspective of the Talend Studio, a corresponding analysis item is listed under the Analyses folder in the DQ Repository tree view.
The number of the analyses created in Talend Studio will be indicated next to this Analyses folder in the DQ Repository tree view.

This analysis list gives you an idea about any problems in one or more of your analyses before even opening the analysis.
When an analysis fails to run, a small red-cross icon is appended on it. When an analysis runs correctly but has violated thresholds, a warning icon is appended on such analysis.
