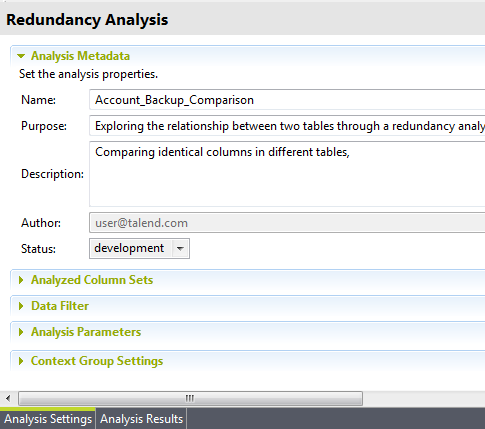
Comparing identical columns in different tables
Before you begin
At least one database connection is set in the Profiling perspective. For further information, see Connecting to a database.
Through this view, you can also access the actual analyzed data via the Data Explorer.
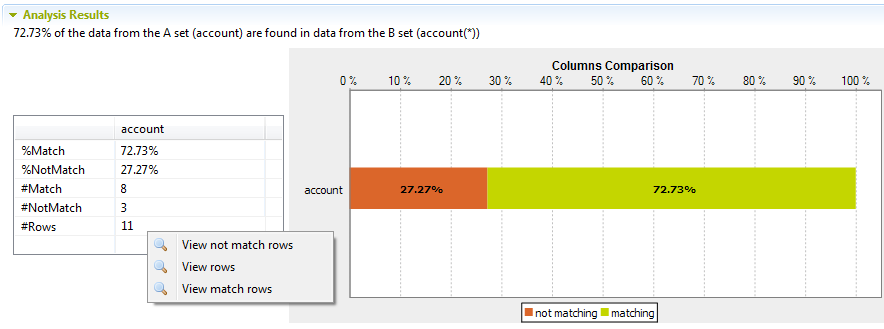
- View match rows: access a list of all rows that could be matched in the two identical column sets.
- View not match rows: access a list of all rows that could not be matched in the two identical column sets.
- View rows: access a list of all rows in the two identical column sets.
The figure below illustrates the data explorer list of all rows that could be matched in the two sets, eight in this example.
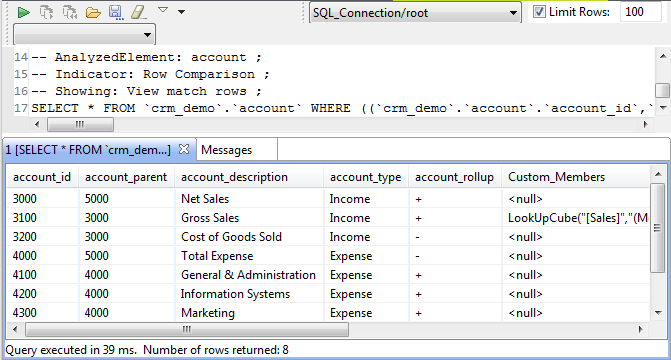
From the SQL editor, you can save the executed query and list it under the Libraries > Source Files folders in the DQ Repository tree view if you click the save icon on the editor toolbar. For more information, see Saving the queries executed on indicators.
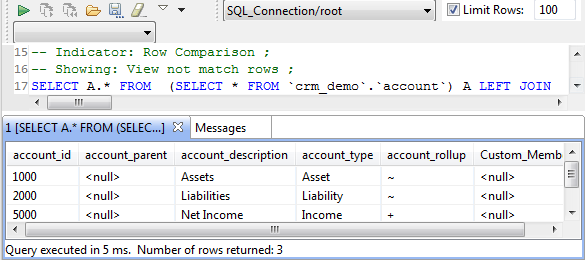
The figure below illustrates the data explorer list of all rows that could not be matched in the two sets, three in this example.
Defining the redundancy analysis
Procedure
-
Right-click the Analyses folder and select
New Analysis.
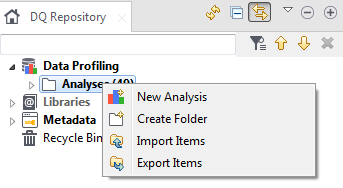 The Create New Analysis wizard opens.
Selecting the identical columns you want to compare
Procedure
-
Expand DB connections and in the desired
database, browse to the columns you want to analyze, select them and then click
Finish to close the wizard.
A file for the newly created analysis is listed under the Analysis folder in the DQ Repository tree view. The analysis editor opens with the defined analysis metadata.
 The display of the analysis editor depends on the parameters you set in the Preferences window. For more information, see Setting preferences of analysis editors and analysis results.
 -
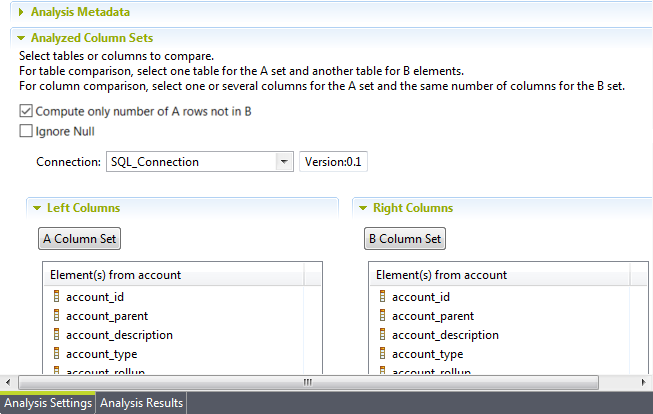
Click Analyzed Column Sets to open the view where
you can set the columns or modify your selection.
In this example, you want to compare identical columns in the account and account_back tables.
-
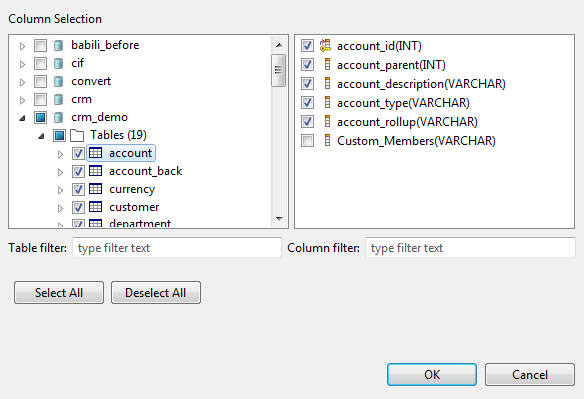
In the list to the right, select the check boxes of the columns you want to
analyze and click OK to proceed to the next step.
 You can drag the columns to be analyzed directly from the DQ Repository tree view to the editor.If you right-click any of the listed columns in the Analyzed Columns view and select Show in DQ Repository view, the selected column will be automatically located under the corresponding connection in the tree view.
Finalizing and executing the analysis
Procedure
Results
In this example, 72.73% of the data present in the columns in the account table could be matched with the same data in the columns in the account_back table.