Using notifications and logs to debug a pipeline
Before you begin
-
You have previously created a complete pipeline.
-
You have executed your pipeline and the execution failed.
Procedure
-
Open the pipeline that failed.
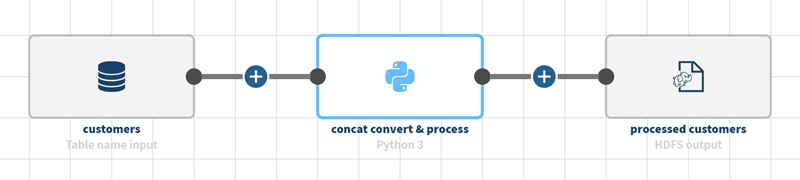
Here, this pipeline contains a database table about customers, a Python 3 processor that concatenate names, converts currency and processes dates, and a HDFS topic to store the processed data.
-
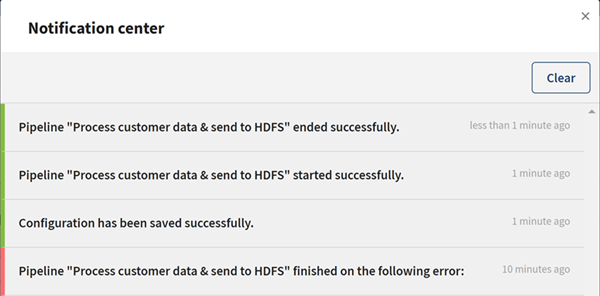
To display the error message that informs you about the execution status, click
the
 icon on the top
toolbar.
icon on the top
toolbar.
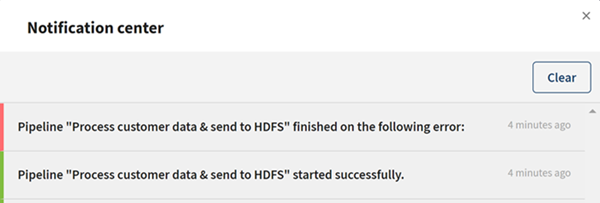
From that window, you can expand the error message by clicking on it.
-
To sort the logs and only read the error messages, select the
Error check box.
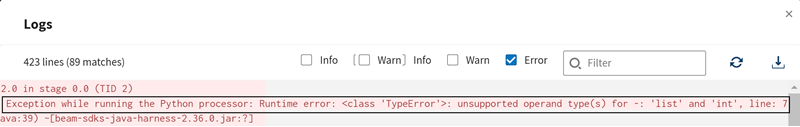
You can see that the error is linked to an incorrect operator used in the Python 3 processor on line 7.
-
Now that you have spotted the error, select the
Python 3 processor to edit
its configuration.
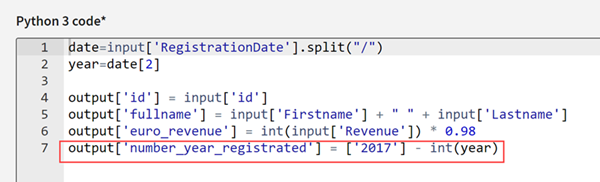
On line 7 here, the year 2017 is surrounded by unnecessary operators that cause the pipeline to fail. Edit the line as follows:output['number_year_registrated'] = 2017 - int(year) and save your changes.
Results