Skip to main content Skip to complementary content

Browsing Service Metadata in Kibana dashboard

About this task

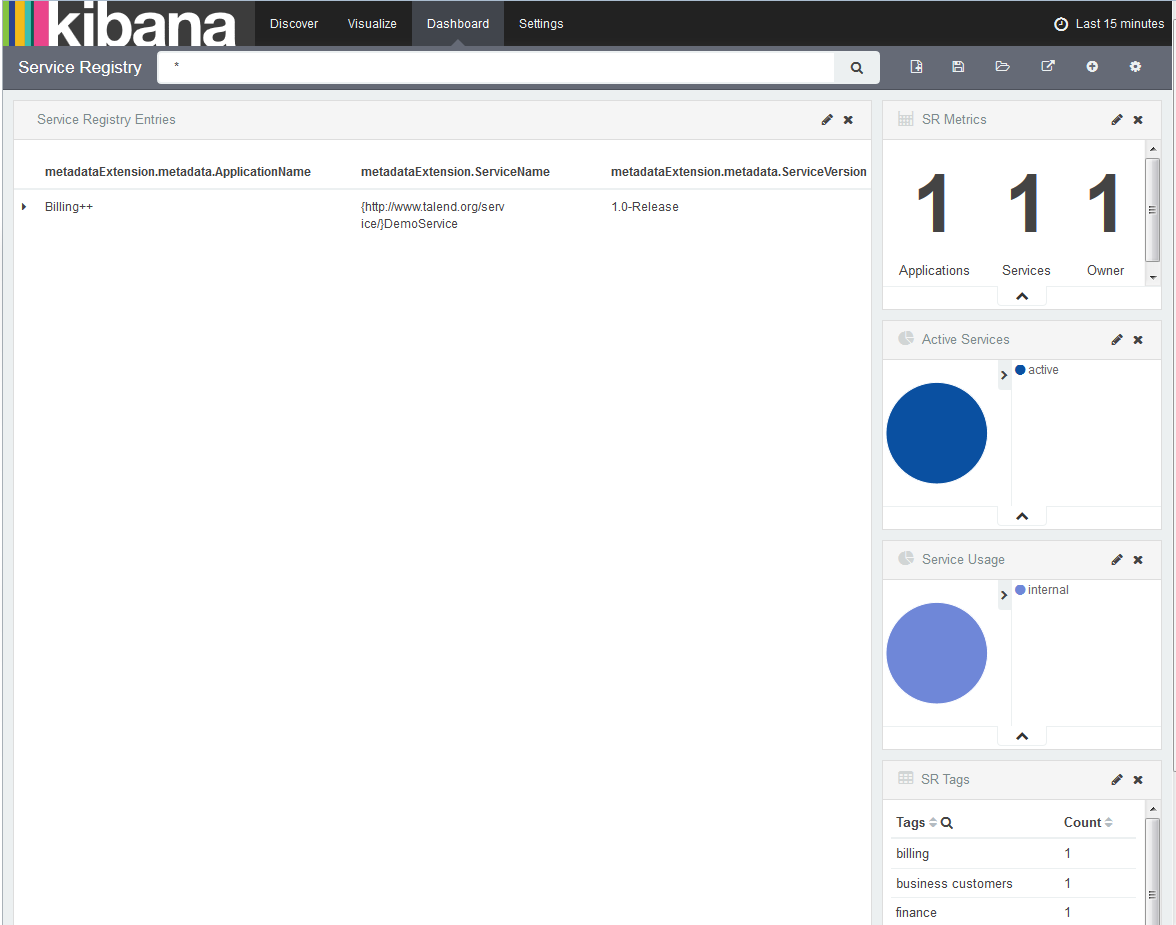
A Kibana dashboard definition Service-Registry-Dashboard.json is provided in the /add-ons/ registry/dashboard folder for browsing metadata stored in ElasticSearch with Kibana. This dashboard is designed for the example metadata schema which comes with the Talend ESB installation. For custom metadata, the dashboard definition must be modified to reflect the properties of the custom metadata.

To install the dashboard:

Procedure

  1. Open Kibana. For more information, see the Talend Administration Center User Guide.
  2. Create an index pattern talendregistry from the Settings > Indices page.
  3. Switch to the Discover page and select the talendregistry index pattern. Make sure there are Service Registry metadata JSON data shown on the right side of the page.
  4. Switch to the Settings > Objects page, select the visualizations tab view, then click the Import button. Select the file Service-Registry-Dashboard.json. You will see four visualizations, one search, and one dashboard are added.
  5. Switch to the Dashboard page, click Load Saved Dashboard, then select Service Registry. You will see the Service Registry metadata dashboard is shown:

    Example

Did this page help you?

If you find any issues with this page or its content – a typo, a missing step, or a technical error – please let us know!