Data profiling area
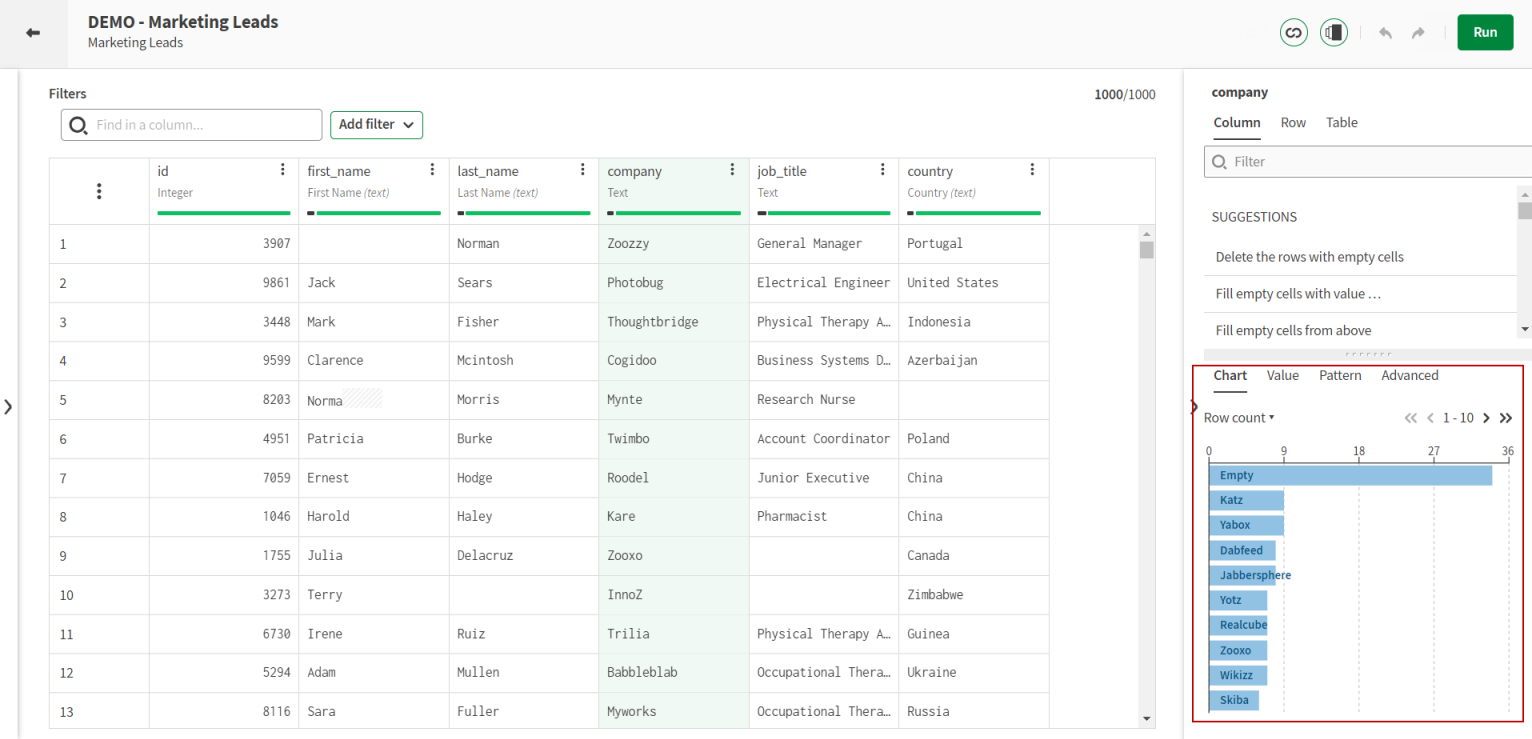
The Chart tab
The Chart tab shows a graphical representation of your data. It is also a quick and easy way to apply filter on your data.
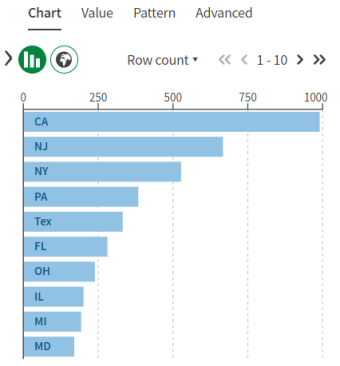
According to the data type or semantic type that you select, the graphical representation of the distribution of values in the tab will be different:
- Vertical bar charts for numerical data
- Horizontal bar charts for text data
- World map for Continent and Continent Code, Country, Country Code ISO2 and Country Code ISO3
- Map of North America for North American state and North American state code
- US map for US State and US State Code
- Map of Mexico for MX Estado and MX Estado Code
- Map of Canada for CA Province Territory and CA Province Territory Code
- Map of France for FR Departement, FR Region and FR Region Legacy
For more information and examples, check Filtering values using charts.
The Value tab
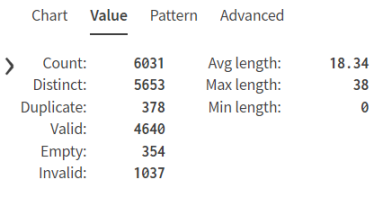
- Count: Number of values in the column
- Distinct: Number of different values in the column
- Duplicate: Number of identical values in the column
- Valid: Number of valid values in the column
- Empty: Number of empty records in the column
- Invalid: Number of invalid values in the column
- Avg length: Average length of the string values based on the number of characters in the column records
- Min length: Minimum length of the string values based on the number of characters in the column records
- Max length: Maximum length of the string values based on the number of characters in the column records
- Min: The lowest value of the column
- Max: The highest value of the column
- Mean: The average value of the column
- Variance: The distribution of the values compared to the mean value. Mathematically defined as the average of the squared differences from the mean value.
The Pattern tab
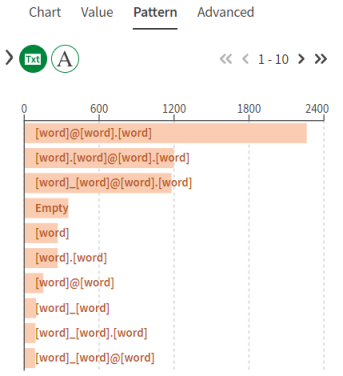
In other words, you will be able to see how the records are structured, with either a word, or character granularity. It is also a quick and easy way to apply filter on your data.
When selecting the content of a column, a horizontal bar chart will display the repartition of the different patterns that are used. According to the type of data that you select, the default displayed patterns will be different:
- Word-based if the column type is text or boolean
- Character-based if the column type is date or number
But whatever the type of data, you can switch between the character-based or word-based patterns from the Pattern tab.
Analyzing word-based patterns would be an efficient way to detect data quality issues in first names or last names, for example. Names that are not exclusively made of words, with punctuation or numbers, will immediately stand out. On the other hand, character-based patterns would be more suited in the case of structured data, such as client ids or account numbers. You will be able to tell from the chart if the number of characters or digits is not the right one.
For more examples, check Filtering values using patterns.
The Advanced tab
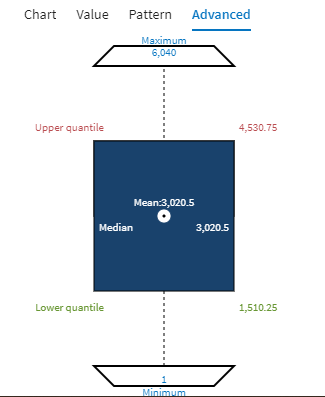
- Maximum: The highest value of the column records
- Minimum: The lowest value of the column records
- Mean: The mean value of the column records
- Median: The median value of the column records
- Upper quartile: The median value between the median and the highest value (maximum) of the column records
- Lower quartile: The median value between the lowest value (minimum) and the median value of the column records
