Executing the Job
Procedure
Results
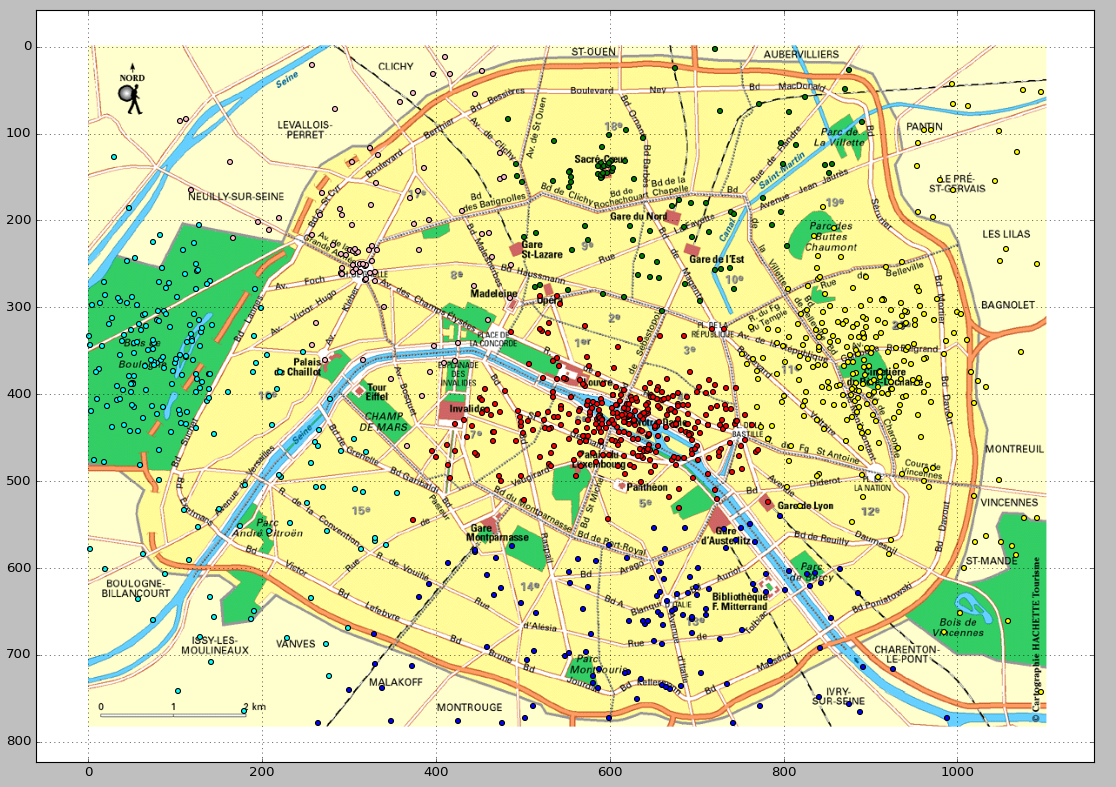
The following image shows an example of the predicted clusters. This visualization is produced via a Python script. You can download this script from here and bear in mind to adapt the path in the script to access the prediction result in your own machine.