
Viewing the distribution graphic display
Go to the Environment category on the left part and select an environment by clicking its name:
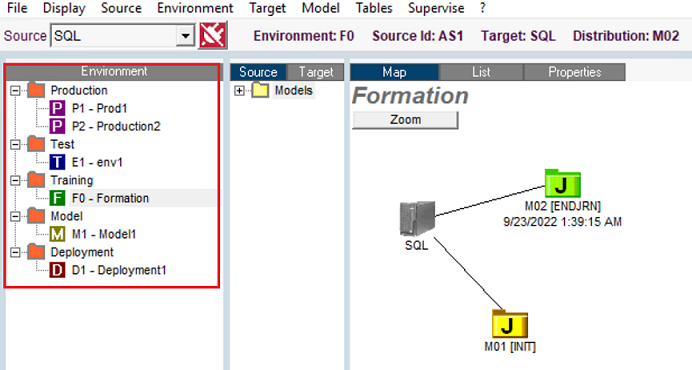
The right-hand area of this display shows the graphic representation of the distribution with its updated activity. You can change the update frequency by using the menu option.
The distribution icons are symbolized with:
- a letter to indicate the distribution type (J for JOURNAL, E for EXTRACT, B for BACKUP),
- a color for the distribution status:
| Color | Meaning |
|---|---|
| Yellow | Distribution stopped without error |
| Green | Replicating distribution |
| Red | Distribution stopped with error(s) |
| Green/Red | Distribution replicating with error(s) |