
Monitoring the Service events
In the Menu tree view, click Service Activity Monitoring to open the Service list.
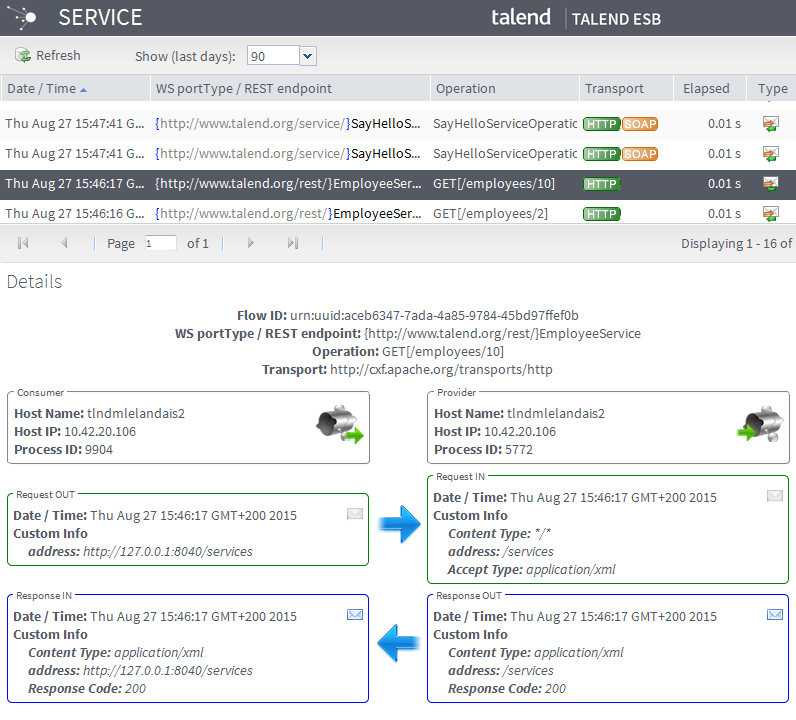
The Service Activity Monitoring list provides aggregated information where all events related to the same message exchange are grouped together.
For example: One single request-response call could translate into 4 events in Service Activity Monitoring , two from the consumer side (Request-OUT and Response-IN) and two from the provider side (Request-IN and Response-OUT).
The Service Activity Monitoring table displays an aggregated view where each row groups up to four events. Information provided includes:
|
Label |
Description |
|---|---|
|
Date/Time |
Date and timestamp of the event being monitored |
|
WS portType / REST endpoint |
PortType name including binding address for SOAP services, or the endpoint name including the URI location for REST services |
|
Operation |
Requested web service operation for SOAP services, or the HTTP method (GET|POST|PUT|DELETE) and the relative address for REST services |
|
Transport |
Type of transport used for messages: HTTP/SOAP (1.1/1.2) |
|
Elapsed |
Elapsed time since the service request was issued |
|
Type |
Shows the message exchange type of the operation: request-response or oneway. |
You can access the event or message exchange details by clicking on it.