Reliability
Open and transparent
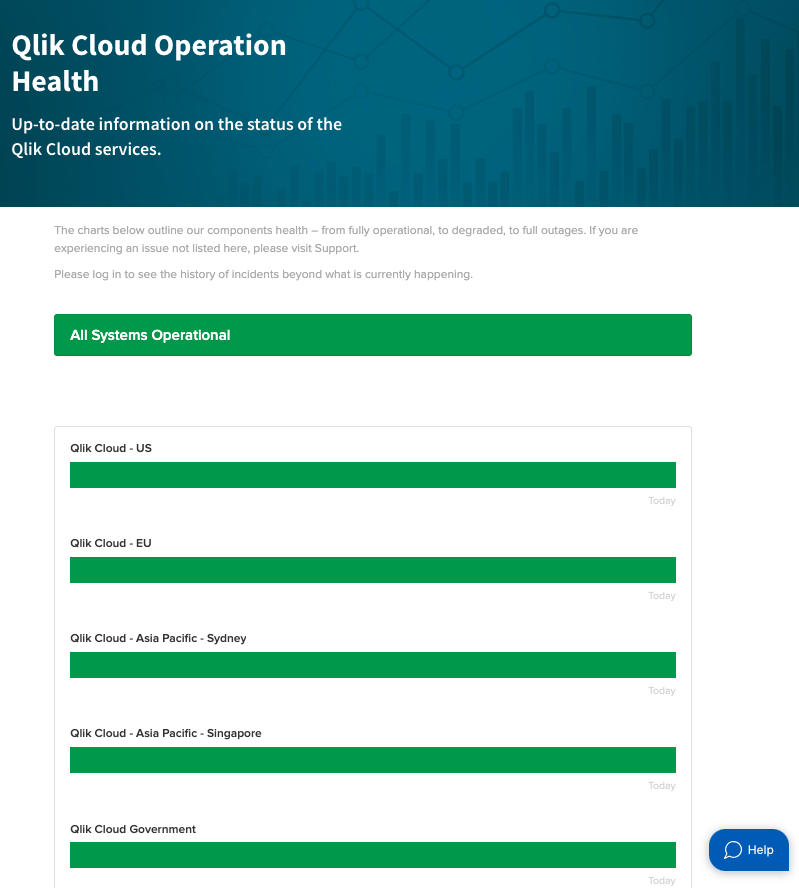
Qlik makes data on uptime and incidents publicly available so that customers and prospective customers can see and understand the current status and reliability of the Qlik Cloud platform on which Qlik’s SaaS offerings run. This information is available at Qlik Cloud Operational Health.

Customers can see the overall uptime of the platform as well as look into specific issues that have occurred to see details on the impact.
Global presence
Support multiple regions throughout the world
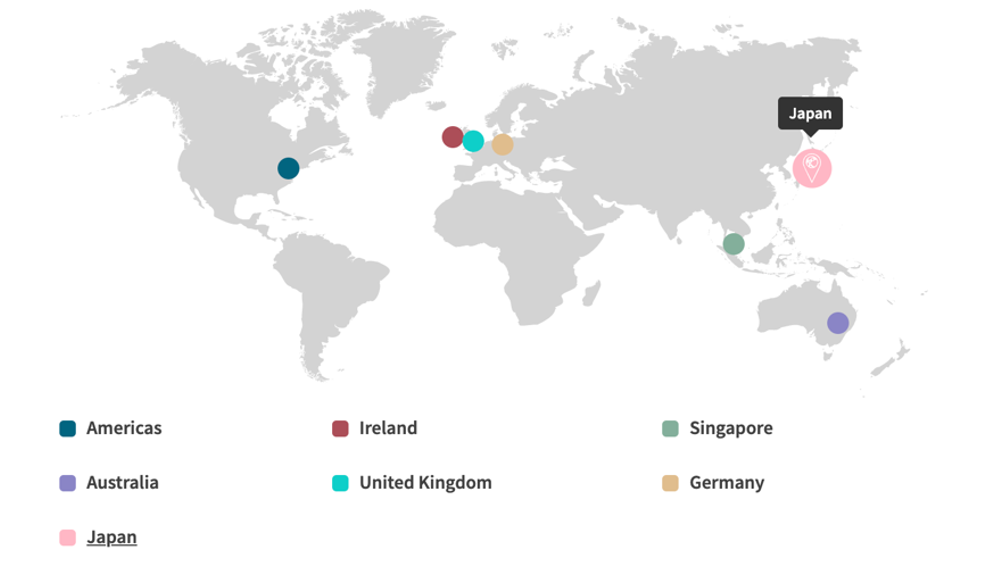
Upon the creation of a Qlik Cloud tenant, customers choose the region in which their tenant is based:
- Australia
- Frankfurt
- Ireland
- Japan
- London
- Singapore
- United States
Customers can therefore select a region to suit their business requirements. Qlik regularly reviews customer demand for new regions. Qlik introduced a new region in Tokyo early in 2024 and plans further regions in the near future.

Adaptable high-availability infrastructure
The Qlik Cloud platform runs on AWS’ mature, highly available, fault-tolerant infrastructure stack, and is deployed across multiple data centers in multiple regions. Further, the platform is built using a microservice-based architecture running on Kubernetes, and is designed from the ground up around scalability and fault tolerance. This allows the platform to instantly adapt to any changes and patches, minimizing any potential downtime for the platform.
Disaster recovery/backup and recovery
Qlik’s SRE team performs disaster recovery tests regularly. As part of these tests, the team builds an entire new Qlik Cloud region. The disaster recovery test is only deemed successful once the new region is brought up, 100% of the replicated data is recovered, and tenants are fully utilizable from the last backup/replication period.
Data and platform information on Qlik Cloud related to customer tenant configuration and metadata is stored in a manner that allows for replication to secondary regions. Customer data files are backed up daily. For details on the associated backup region for each Qlik Cloud primary region, see Creating and configuring the tenant.
Site reliability engineering
Spotlight – The Site Reliability Engineering process at Qlik
Based on Google’s service reliability hierarchy, Qlik’s SRE team focuses on the following areas:
Monitoring: Our SRE team ensures that every service delivered to production can communicate to Qlik about how it is performing, so that our SRE team is aware of problems as they may arise.
Incident response: The SRE team prepares the appropriate response plan for the problem. The various options available to the SRE team are documented in service-specific playbooks and highlight the best way to deal with a service that is operating in a less than optimal manner.
Postmortems and root cause analysis: When the SRE team is alerted that a service has been degraded in production, the SRE team needs to ensure that the underlying problem is fixed as quickly as possible. A postmortem is a documented record of an incident, its impact, the actions taken to minimize or resolve it, the root cause, and the follow-up actions to prevent the incident from reoccurring. In many cases, one of the outcomes of the postmortem process is to add an additional automated test to the continuous delivery pipeline to ensure that functional issues do not reoccur.
Capacity planning: The SRE team participates in the ongoing designs of new services and the impacts that new features and modifications may have on existing services. These include:
- How services scale up to handle increased traffic load
- How services scale down to seamlessly accommodate reduced capacity
- What are the optimal size and performance characteristics of infrastructure
- Which services require auto-scaling
Development: The SRE team continually innovates around performance and scalability of the platform. Some examples include:
- Continual enhancement of measurement and monitoring tools
- Continual improvements to and expansions of automation capabilities
Measurement: Internal metrics, such as service level indicators and service level objectives, are used by the SRE team to continuously monitor the performance of the environment
Did this page help you?
If you find any issues with this page or its content – a typo, a missing step, or a technical error – let us know how we can improve!
