
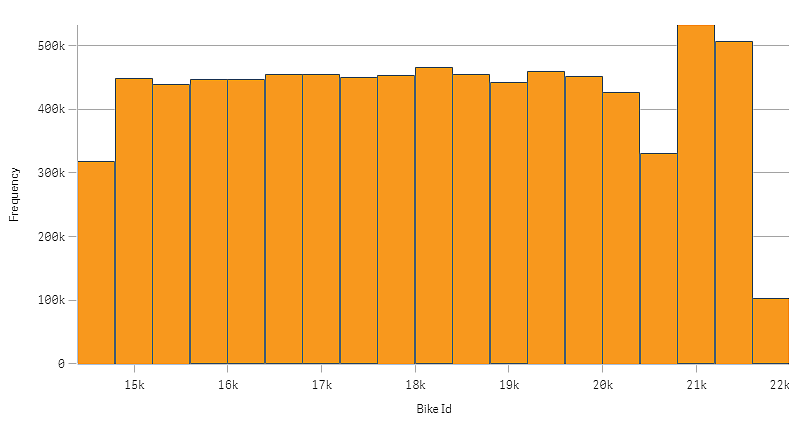
The histogram is suitable for visualizing distribution of numerical data over a continuous interval, or a certain time period. The data is divided into bins, and each bar in a histogram represents the tabulated frequency at each bin.
When to use it
The histogram is suitable for visualizing distribution of numerical data over a continuous interval, or a certain time period.
Advantages
The histogram organizes large amounts of data, and produces a visualization quickly, using a single dimension.
Disadvantages
The histogram is not relevant for detailed analysis of the data as it deals with a summary of the data distribution.
Learn more
Related learning: