Nested aggregations
Any field name in a chart expression must be enclosed by exactly one aggregation function. If you need to nest aggregations, you can use Aggr() to add a second aggregation level. Aggr() contains an aggregation function as an argument.
Always one level of aggregation in a function
A typical app may contain:
- one million records in the data
- one hundred rows in a pivot table
- a single KPI, in a gauge or text box
All three numbers may still represent all data, despite the difference in magnitude. The numbers are just different aggregation levels.
Aggregation functions use the values from many records as input and collapse these into one single value that can be seen as a summary of all records. There is one restriction: you cannot use an aggregation function inside another aggregation function. You usually need every field reference to be wrapped in exactly one aggregation function.
The following expressions will work:
- Sum(Sales)
- Sum(Sales)/Count(Order Number)
The following expression will not work because it is a nested aggregation:
- Count(Sum(Sales))
The solution to this comes in the form of the Aggr() function. Contrary to its name it is not an aggregation function. It is a "many-to-many" function, like a matrix in mathematics. It converts a table with N records to a table with M records. It returns an array of values. It could also be regarded as a virtual straight table with one measure and one or several dimensions.
Using Aggr() for nested aggregations
Aggr() returns an array of values for the expression, calculated over the stated dimension or dimensions. For example, the maximum value of sales, per customer, per region. In advanced aggregations, the Aggr() function is enclosed in another aggregation function, using the array of results from the Aggr() function as input to the aggregation in which it is nested.
When it is used, the Aggr() statement produces a virtual table, with one expression grouped by one or more dimensions. The result of this virtual table can then be aggregated further by an outer aggregation function.
Calculating largest average order value
Let us use a simple Aggr() statement in a chart expression.
We want to see our overall metrics at the regional level, but also show two more complex expressions:
- Largest average order value by manager within each region.
- Manager responsible for that largest average order value.
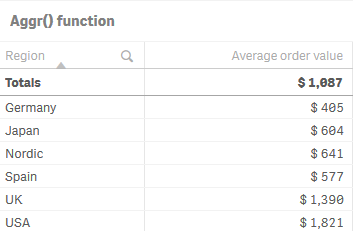
We can easily calculate the average order value for each region using a standard expression Sum(Sales)/Count([Order Number]).
Inside the app, on the Nested Aggregations sheet you will find a table titled Aggr() function.
Do the following:
- Select the available Aggr() function table.
The properties panel opens. - Click Add column and select Measure.
- Click on the
symbol.
The expression editor opens. - Enter the following: Sum(Sales)/Count([Order Number])
- Click Apply.

Our goal is to retrieve the largest average order value for each region. We have to use Aggr() to tell Qlik Sense that we want to grab the average order value for each region, per manager, and then display the largest of those. To get the average order value for each region, per manager, we will have to include these dimensions in our Aggr() statement:
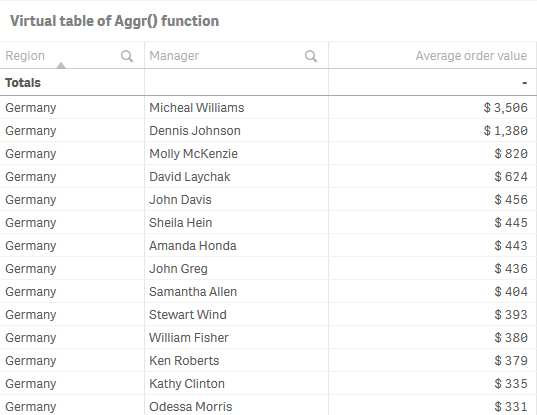
Aggr(Sum(Sales)/Count([Order Number]), Region, Manager)
This expression causes Qlik Sense to produce a virtual table that looks like this:

When Qlik Sense calculates the individual average order values for each region, per manager, we will need to find the largest of these values. We do this by wrapping the Aggr() function with Max():
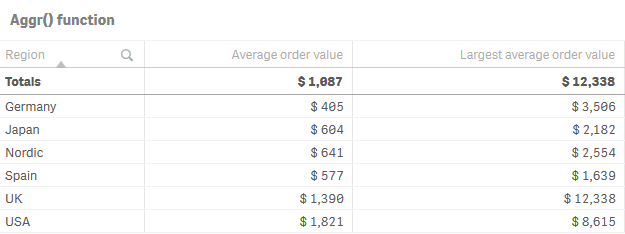
Max(Aggr(Sum(Sales)/Count([Order Number]), Manager, Region))
Do the following:
- Click Add column and select Measure.
- Click on the
symbol.
The expression editor opens. - Enter the following : Max(Aggr(Sum(Sales)/ Count([Order Number]), Manager, Region))
- Click Apply.

You can see the largest average order value for all managers at the region level. This is the first of our two complex expressions! The next requirement is to have the name of the manager responsible for these large average order values displayed next to the values themselves.
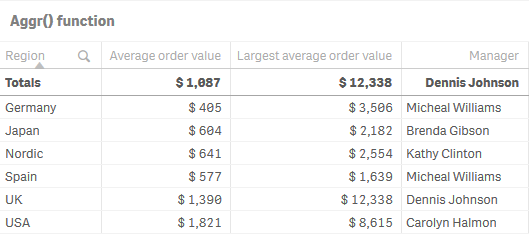
To do this, we will use the same Aggr() function as before, but this time together with the FirstSortedValue() function. The FirstSortedValue() function tells Qlik Sense to provide us with the manager, for the specific dimension specified in the second portion of the function:
FirstSortedValue(Manager,-Aggr(Sum(Sales)/Count(Order Number), Manager, Region))
Do the following:
- Click Add column and select Measure.
- Click on the
symbol.
The expression editor opens. - Enter the following: FirstSortedValue(Manager,-Aggr(Sum(Sales)/ Count([Order Number]), Manager, Region))
- Click Apply.

For more information see Aggr
For more information see FirstSortedValue
