Viewing content viewer and item usage metrics
Viewer and usage metrics allow you to quantify the value of your content at-a-glance by showing both the number and trend of unique viewers in the last 28 days (Viewed by) as well as the number of applications that are currently using a particular item (Used in).
Usage metrics are turned on by default in a tenant and can be turned off by a tenant administrator. If you do not see these statistics in your tenant, it is likely they are turned off. For more information, see Displaying content usage metrics.
Content viewer metric
The viewer metric for content shows a count of how many unique users have accessed content in the last 28 days.
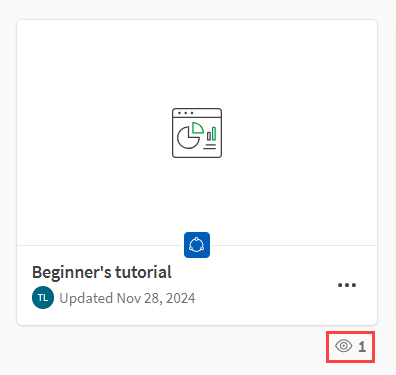
Viewer metrics on an app

An item's view count over the last 28 days is a good indication of its popularity. Knowing how many times an item has been viewed recently also helps content owners gain valuable insights into their work. For instance, an item that has been viewed by a relatively small number of users might indicate that the item is no longer useful or needs to be improved to increase its popularity.
Viewer metric limitations
The viewer metric is not available for automations.
Item usage metric
The item usage metric shows how many applications are using a particular dataset at any given time. By clicking the metric, you can drill-down further to view impact analysis.
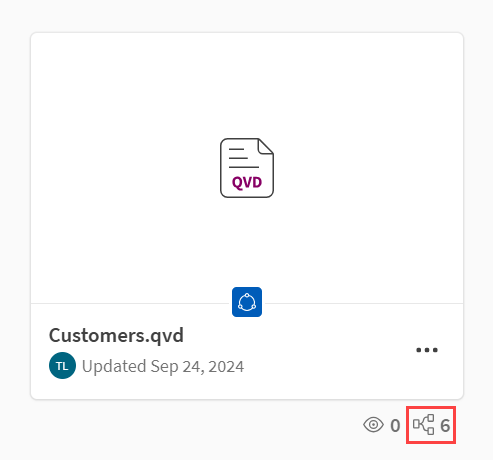
Item usage metric

As items with a higher number of dependencies are usually of higher quality, an awareness of such dependencies provides a useful means of quantifying item quality. Data and analytics producers can then leverage higher quality items to create additional content, while content owners can determine the impact of any changes to the content.
Usage metric limitations
Item usage metrics are available for the following content types:
-
Data
Understanding metrics icons
The table below describes the icons that are used to display viewer and item usage metrics in Grid view. Hover over an icon to bring up a tooltip with more information. Note that the arrowhead icon used to indicate viewer trends is also shown in List view.
| Details | Description |
|---|---|
|
|
The number of unique viewers over the last 28 days. |
|
|
The number of applications using a particular item. You can click the icon to view impact analysis. |
Metrics locations
Viewer and usage metrics are available in the locations listed below:
-
Catalog Grid view
-
Catalog List view
-
Dataset Overview tab
-
Content Details
Grid view
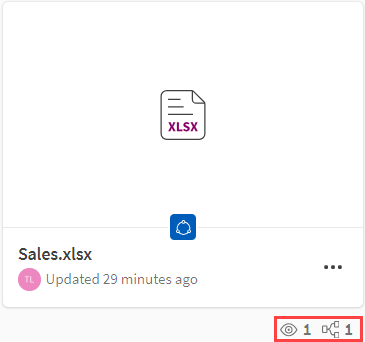
Below the content tile in Grid view:
Metrics on a data asset tile

Hovering over the metrics icons will show a tooltip with more information.
List view
For any item, hovering over the Viewed by or Used in numbers will show a tooltip with more information. You can also click the number in the Used in column to view impact analysis. Note that the Used in metric is not shown for apps as it is only relevant for datasets.
![]()
Dataset Overview tab
In the Overview tab of datasets, you can view the metrics under Details.
![]()
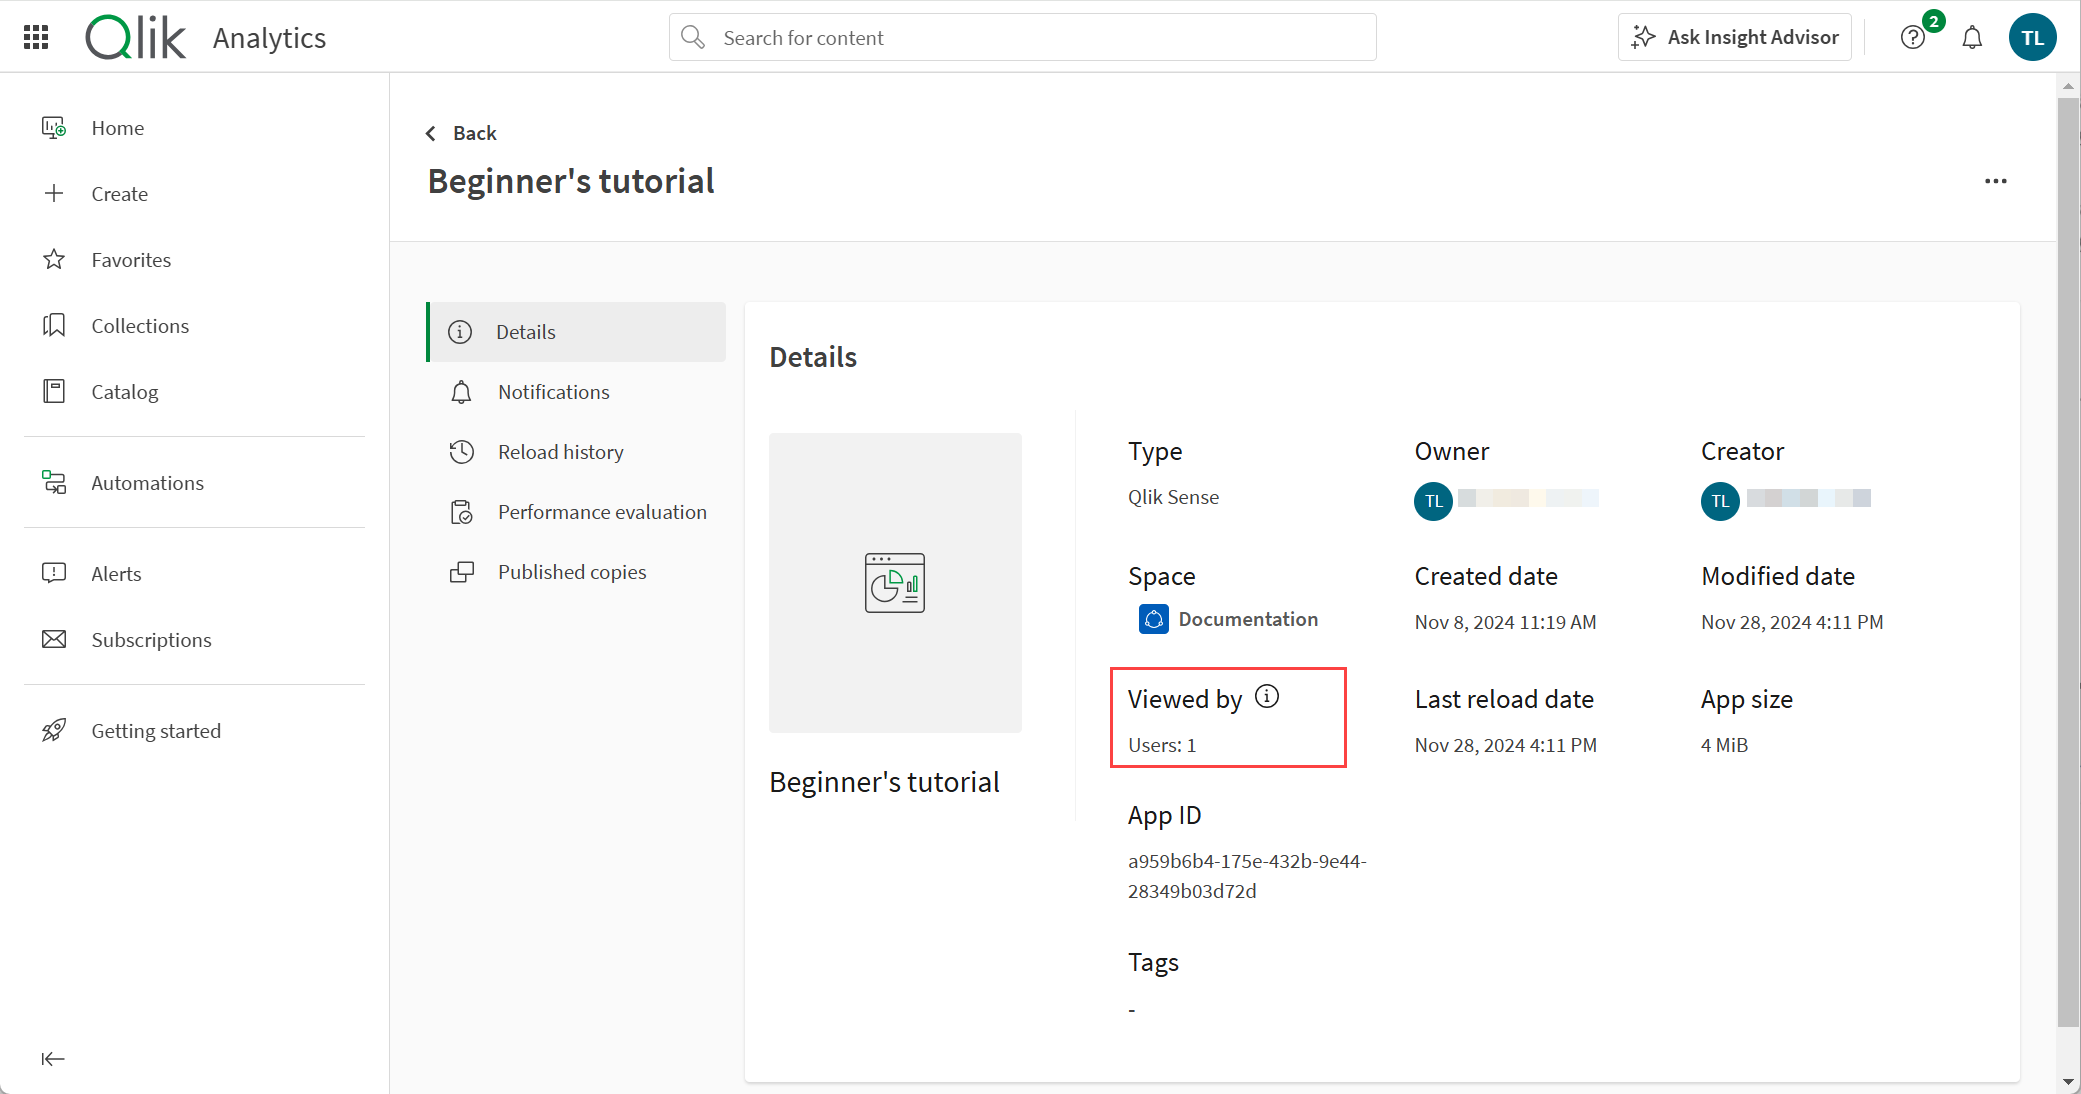
Content Details
Viewer metrics can be viewed in Details for content types with metrics. On the content in catalog, click > Details. In Details, the viewer metrics are under Viewed by. Hovering over the
icon will show a tooltip with more information.
Viewer metrics are not available in scripts.
Details in an app, showing the viewer metrics

