On-premises servers topology
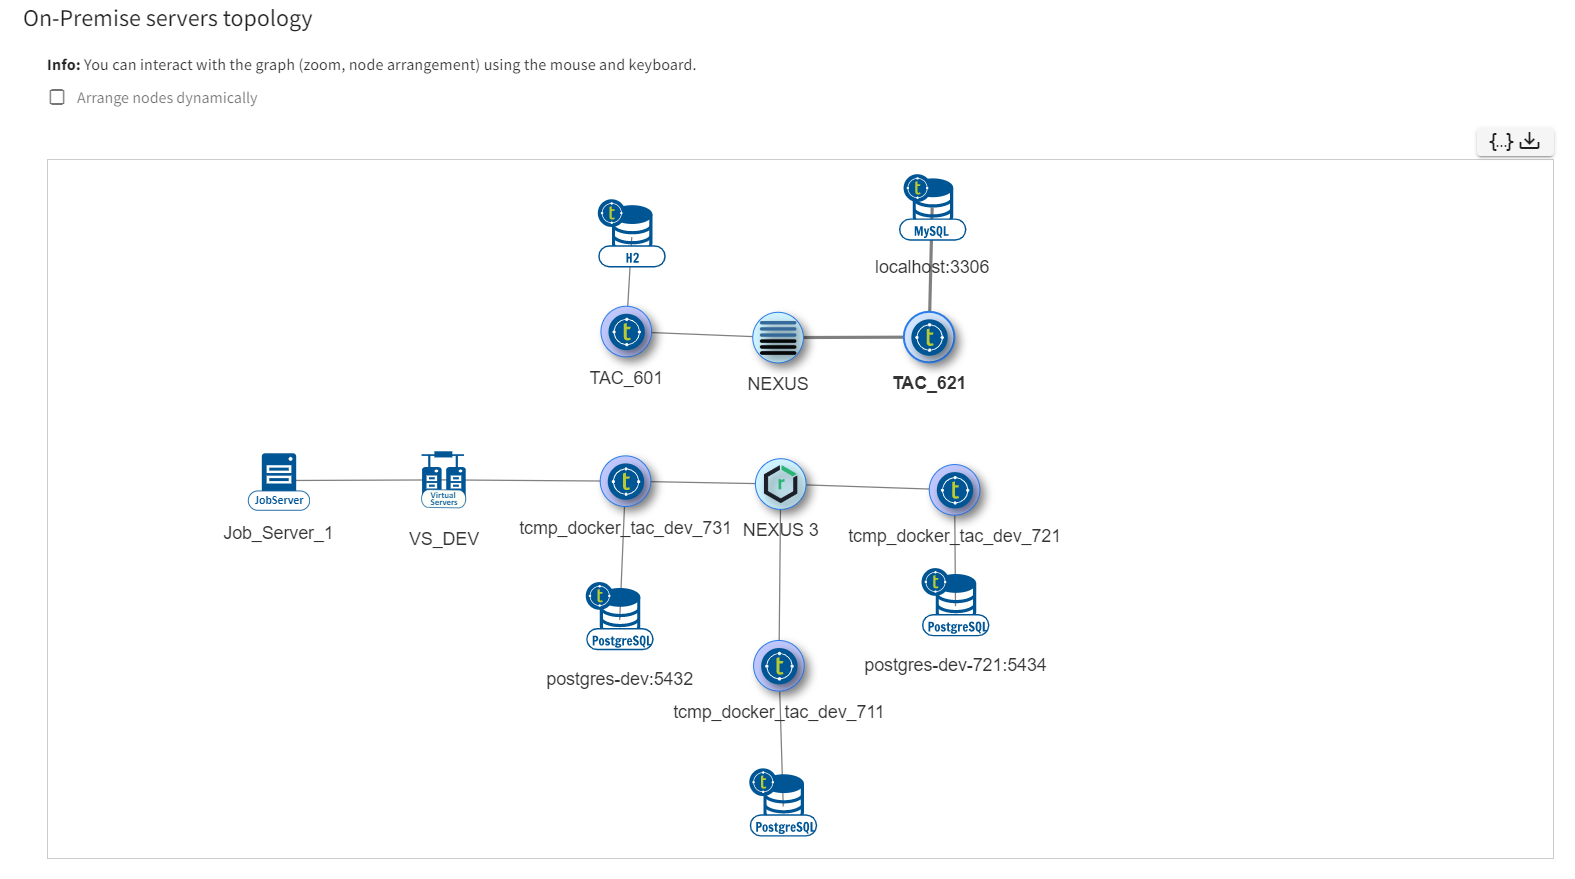
This dashboard displays a network graph with the list of the main Talend on-premises servers, including the Talend Administration Center database.

The graph is dynamic: each node can be moved independently in the canvas. If Enable physics is set, the graph automatically organizes itself based on the weight of each node determined by the number of connections to it. You can arrange them at your convenience to get a better distribution.
An option is provided to export the raw data as a JSON file.
