Skip to main content Skip to complementary content

Creating "or" conditions on cities

To create a condition, or a filter on several text values at the same time, like cities, you can use the Chart panel to select multiple values. You can even use the navigation arrows to browse past the first 10 results. However the statistics from the charts are only based on the 10 000 rows sample. If your dataset is larger than that, just like the car dealership dataset, you may miss potential records that are beyond this sample. So if you want to make sure your filter returns all the matching rows, you need to proceed differently. You will need to create a regular expression matching all the text values of your choice, filter on rows that match this regular expression, and use the Fetch more feature to retrieve all the other rows matching this filter.

Using the previously imported car dealership dataset, you will create a new preparation and create a filter to display the sales that occurred in the five biggest cities in France.

Creating a regular expression to match the cities

You will create a regular expression to match all the cities you are interested in, in other words the five biggest cities in France: Paris, Lyon, Marseille, Toulouse, and Bordeaux.

Procedure

  1. Click the header of the city column to select its content.
  2. In the functions panel, on the right side of the screen, type Match pattern and click the result to open the options for the associated function.
  3. In the Pattern field, select Other.
  4. From the Manual pattern drop-down list, select RegEx.
  5. In the Manual pattern field, enter the following regular expression:
    ^Paris$|^Marseille$|^Lyon$|^Toulouse$|^Bordeaux$

    This expression will match all the sales that occurred in these five cities.

  6. Click Submit.

Results

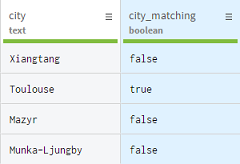
A new column is created, where rows that match the regular expression are marked as true, while those who do not are marked as false.
New column added to the preparation, showing if the corresponding values match the expression.

Filtering on the matching values

Now that you have a way of knowing which rows match the regular expression, you will be able to retrieve them all by creating a filter on this new column.

Procedure

  1. Click the header of the city_matching column to select its content.
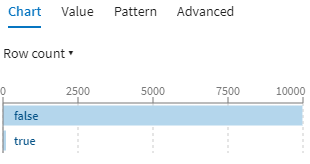
    In the data profiling area, on the bottom right of the screen, you can see a horizontal bar chart showing the repartition between the true and false values in the column. Point your mouse over each bar to display the exact number of occurrences.
    Bar chart showing the repartition of true and false values.
  2. To create the filter, click the true bar.
    You can see from the filter bar that the filter was applied on the dataset, and customers data is only displayed if it matches the condition previously set by the regular expression.

Results

With this filter based on several values, you have isolated sales involving customers from the specified cities. However, out of the five values you were looking for, only four were retrieved and it looks like there is no row involving Paris in the dataset. So you will now check if the filter potentially matches more rows beyond your current sample.

Fetching more values for the corresponding cities

The previously created filter did not return all the cities you were interested in, so you will fetch more rows potentially matching it beyond the sample.

Procedure

On the top right of the grid, click Fetch more.
The Fetch more button is available on the top right of the grid.
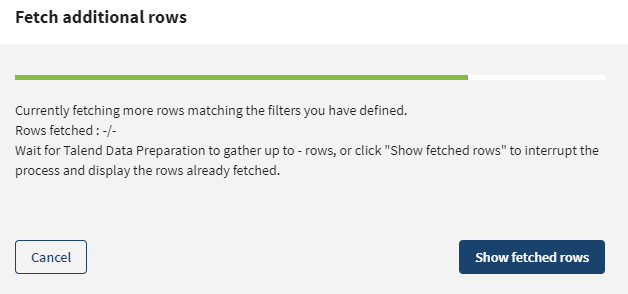
The Fetch additional rows dialog box opens, where you can see the status of the data retrieval.
Modal that opens to show the progress of the rows retrieval.
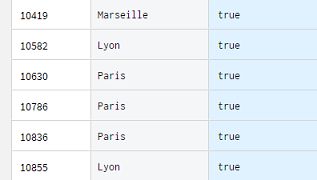
The search automatically ends when it reaches 10,000 results, or the end of the dataset. You also have the possibility to stop the process anytime and show the rows already found. In this case several more rows of customer information were fetched, including some with Paris as city, the last value you were looking for. You can see by the rows ids that they were located beyond the first 10,000 rows of the initial sample.
Matching rows beyond the first 10,000 have been retrieved.

Results

By retrieving all the rows matching your filter across the dataset, you have managed to isolate the sales from all five specified cities. Any filter or function applied from now on will only apply to this sample.

Exporting the rows matching your filters

Now that you have highlighted and prepared a restricted list of customers, you will export it as a local file.

Procedure

  1. Click the Export button.
  2. Select the All data radio button and make sure the Apply filters switch is activated.
    That way, the export will include all the potential rows that match the filter, even beyond the sample if your dataset is bigger than that, in the same manner as the fetch more operation.
  3. Choose the file format you want to use when exporting your data.
    • If you choose Local CSV file, select which field delimiter, text enclosure and escape characters to use and enter a name for the file to export.
    • If you choose Local XLSX file, choose a name for the file to export.
    • If you choose Amazon S3, enter your credentials and other information to store your file on Amazon S3.

Results

The data you cleansed using your preparation is exported to a local file.

Did this page help you?

If you find any issues with this page or its content – a typo, a missing step, or a technical error – please let us know!